Thechartstore.com does not promote the use of the information contained herein for any specific purpose, and makes no representations or warranties that the information contained in this publication is suitable for the particular purposes of the subscriber or any other party. Thechartstore.com assumes no responsibility or liability of any kind for the use of the information contained herein by the subscriber or any other party. Reproduction of any or all of the Weekly Chart Blog without prior permission is prohibited.
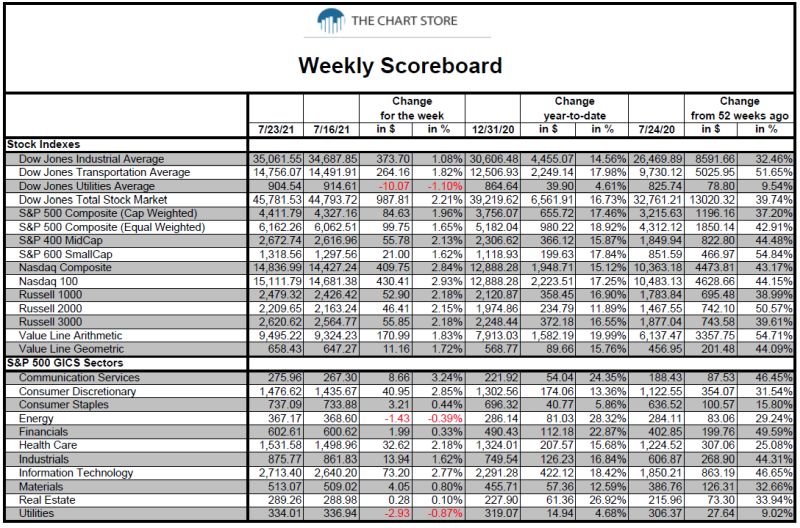
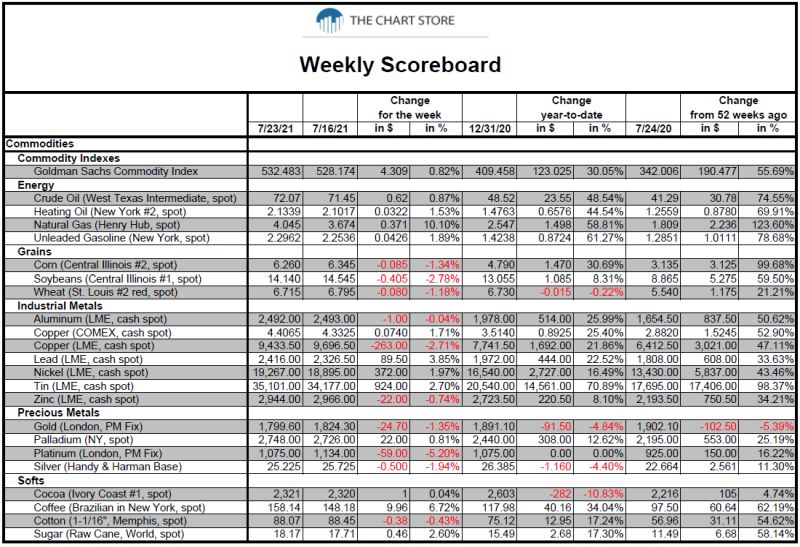
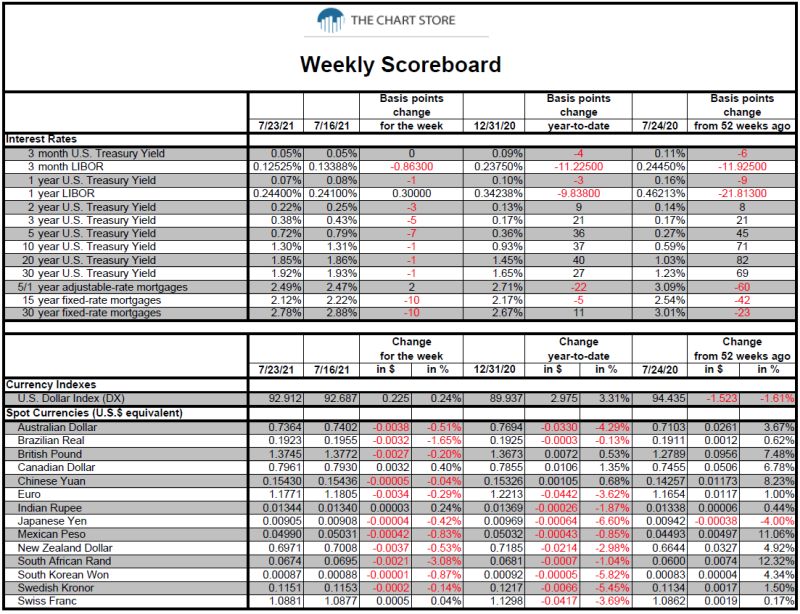
- The Weekly Scoreboard
- Chart 1 is the daily Dow Jones Industrial Average from September 30, 2011.
- Chart 2 is the daily Dow Jones Transportation Average from September 30, 2011.
- Chart 3 is the daily Dow Jones Utilities Average from September 30, 2011.
- Chart 4 is the daily S&P 500 Composite from September 30, 2011.
- Chart 5 is the daily S&P 500 Equal Weighted Index from September 30, 2011.
- Chart 6 is the daily S&P 400 MidCap Index from September 30, 2011.
- Chart 7 is the daily S&P 600 SmallCap Index from September 30, 2011.
- Chart 8 is the daily Nasdaq Composite from September 30, 2011.
- Chart 9 is the daily Nasdaq 100 from September 30, 2011.
- Chart 10 is the daily Russell 2000 from September 30, 2011.
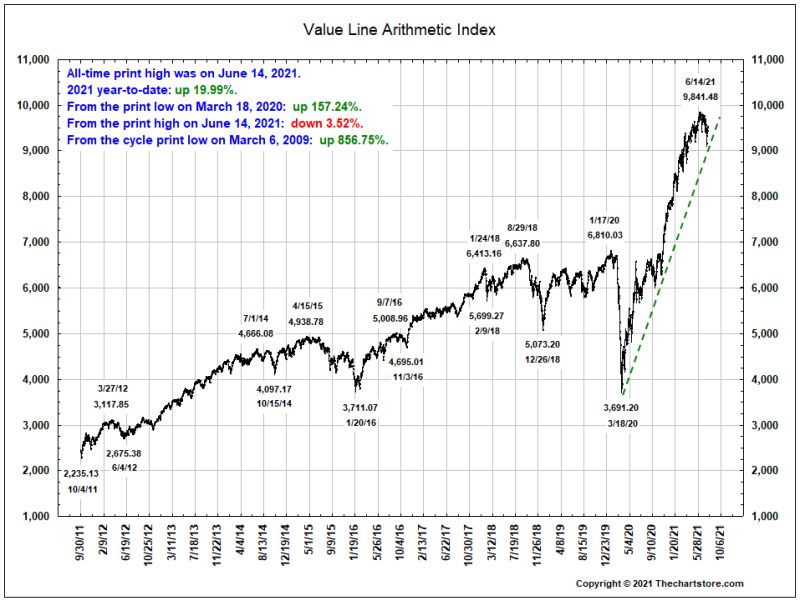
- Chart 11 is the daily Value Line Arithmetic Index from September 30, 2011.
- Chart 12 is the daily S&P 500 GICS Sector – Communication Services from September 30, 2011.
- Chart 13 is the daily S&P 500 GICS Sector - Consumer Discretionary from September 30, 2011.
- Chart 14 is the daily S&P 500 GICS Sector - Consumer Staples from September 30, 2011.
- Chart 15 is the daily S&P 500 GICS Sector - Energy from September 30, 2011.
- Chart 16 is the daily S&P 500 GICS Sector - Financials from September 30, 2011.
- Chart 17 is the daily S&P 500 GICS Sector – Health Care from September 30, 2011.
- Chart 18 is the daily S&P 500 GICS Sector - Industrials from September 30, 2011.
- Chart 19 is the daily S&P 500 GICS Sector – Information Technology with relative from September 30, 2011.
- Chart 20 is the daily S&P 500 GICS Sector - Materials from September 30, 2011.
- Chart 21 is the daily S&P 500 GICS Sector - Real Estate from September 30, 2011.
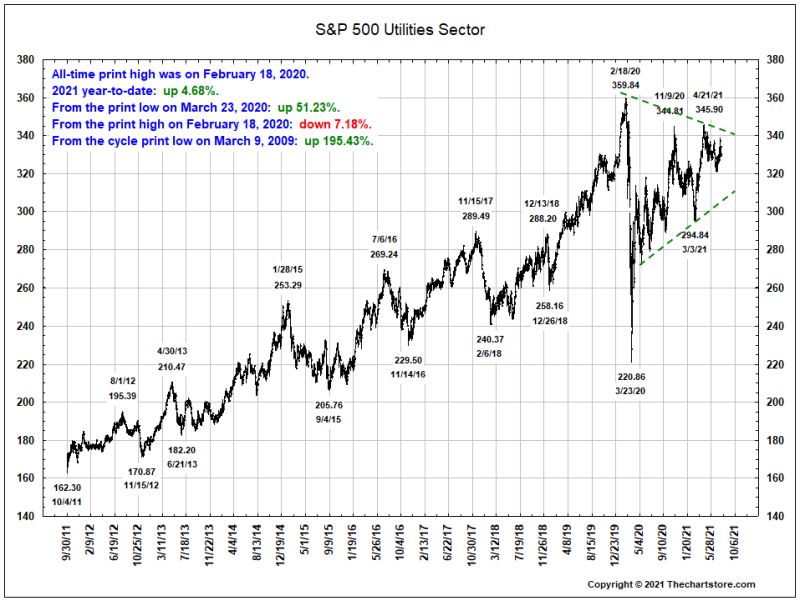
- Chart 22 is the daily S&P 500 GICS Sector - Utilities from September 30, 2011.
- Chart 23 is a swing chart of the daily S&P 500 since August 31, 2018.
- Chart 24 is a swing chart of the weekly S&P 500 since December 26, 2008.
- Chart 25 is a swing chart of the year-to-date percentage moves of the S&P 500 Composite, S&P 400 MidCap and S&P 600 SmallCap.
- Chart 26 is the daily S&P 500 and the S&P 500 advance-decline line since December 30, 2016.
- Chart 27 is the daily S&P 500 and the S&P 500 advance-decline oscillator since December 30, 2016.
- Chart 28 is the daily S&P 500 and the % of S&P 500 stocks above their 50 day moving average since December 30, 2016.
- Chart 29 is the daily S&P 500 and the % of S&P 500 stocks above their 200 day moving average since December 30, 2016.
- Chart 30 is the daily S&P 500 and the Net New Highs or Lows as a % of S&P 500 Stocks since December 30, 2016.
- Chart 31 is the daily S&P 500 with 21 day moving average and Bollinger Bands from December 29, 2017.
- Chart 32 is the daily S&P 500 with 50 day moving average and Bollinger Bands from from December 29, 2017.
- Chart 33 is the weekly S&P 500 with 40 week moving average and Bollinger Bands since December 28, 2007.
- Chart 34 is the weekly S&P 500 with the MACD indicator since December 26, 2008.
- Chart 35 is the weekly S&P 500 with the 10 and 40 week moving averages and the 14 week stochastic since December 31, 2004.
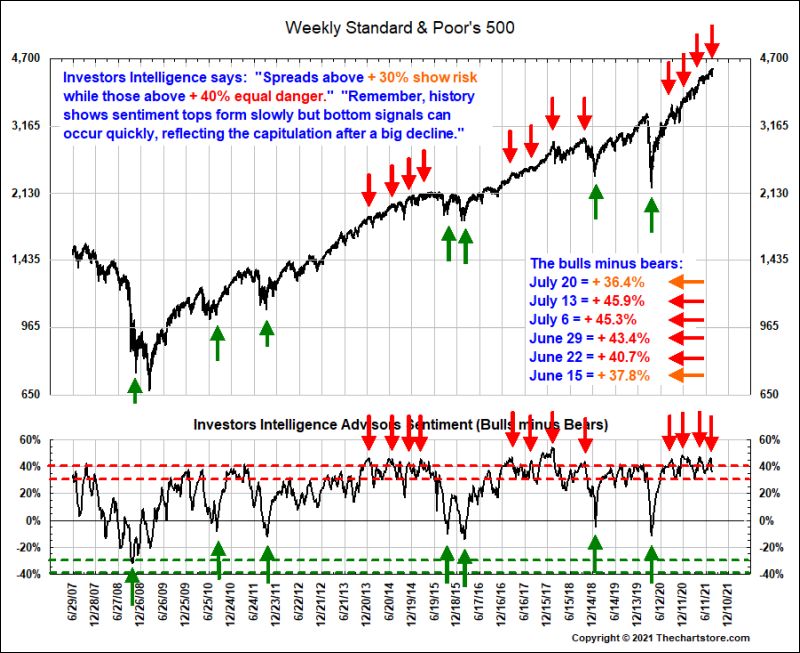
- Chart 36 is the weekly S&P 500 with the Investors Intelligence Advisors Sentiment (Bulls minus Bears) since June 29, 2007.
- Chart 37 compares the current cycle of the weekly S&P 500 to the bottom in 1929.
- Chart 38 compares the current cycle of the weekly S&P 500 to the bottom in 1932.
- Chart 39 compares the current cycle of the weekly S&P 500 to the bottom in 1933.
- Chart 40 compares the current cycle of the weekly S&P 500 to the bottom in 1935.
- Chart 41 compares the current cycle of the weekly S&P 500 to the bottom in 1974.
- Chart 42 compares the current cycle of the weekly S&P 500 to the bottom in 1987.
- Chart 43 compares the current cycle of the weekly S&P 500 to the bottom in 2001.
- Chart 44 compares the current cycle of the weekly S&P 500 to the bottom in 2002.
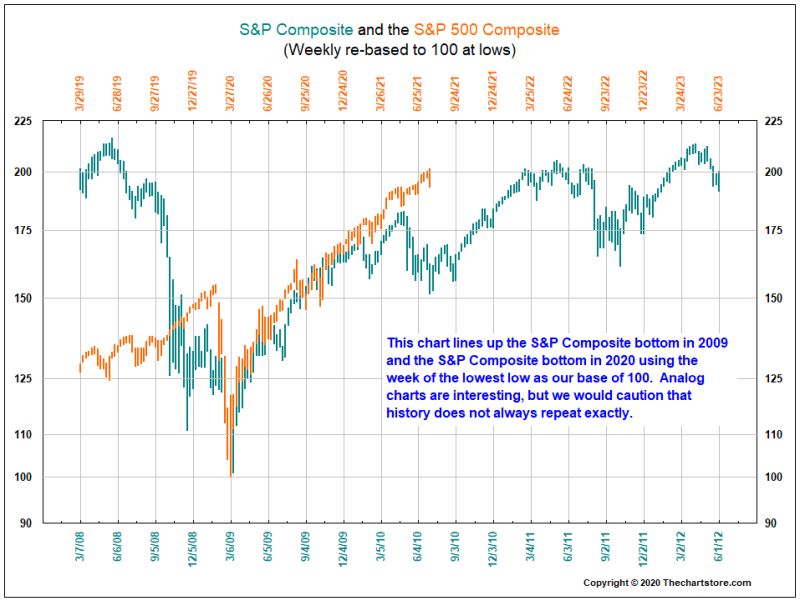
- Chart 45 compares the current cycle of the weekly S&P 500 to the bottom in 2009.
- Chart 46 is the U.S. Treasury Yield Curve, this week, 4 weeks ago and 52 weeks ago.
- Chart 47 is the Real U.S. Treasury Yield Curve, this week, 4 weeks ago and 52 weeks ago.
- Chart 48 is the move in basis points for various maturities of the U.S. Treasury yield curve since July 31, 2019.
- Chart 49 is the daily yield of the U.S. Treasury 10 year constant maturity from December 31, 2010.
- Chart 50 is the daily yield of the U.S. Treasury 30 year constant maturity from December 31, 2010.
- Chart 51 is the weekly yield of the U.S. Treasury 10 year constant maturity with the 10 and 40 week moving averages and the 14 week stochastic since December 31, 1999.
- Chart 52 shows the daily 3 month LIBOR yield, 3 month U.S. Treasury yields and the spread between the two from December 31, 2015.
- Chart 53 shows the daily 1 year LIBOR yield, 1 year U.S. Treasury yields and the spread between the two from December 31, 2015.
- Chart 54 shows the daily Moody’s Aaa yield, U.S. Treasury yield and the spread between the two from December 31, 2015.
- Chart 55 shows the daily Moody’s Baa yield, the Long-term U.S. Treasury yield and the spread between the two from December 31, 2015.
- Chart 56 shows the daily Moody’s Baa yield, Moody’s Aaa yield and the spread between the two from December 31, 2015.
- Chart 57 shows the daily Bank of America Merrill Lynch US Corporate Master Index yield, the 10 year U.S. Treasury yield and the spread between the two from December 31, 2015.
- Chart 58 shows the daily Bank of America Merrill Lynch US High Yield Master II Index yield, the 10 year U.S. Treasury yield and the spread between the two from December 31, 2015.
- Chart 59 shows the daily Bank of America Merrill Lynch US High Yield CCC and Below yield, the 10 year U.S. Treasury yield and the spread between the two from December 31, 2015.
- Chart 60 shows the daily Bank of America Merrill Lynch US Corporate Master Index yield, the 30 year U.S. Treasury yield and the spread between the two from December 31, 2015.
- Chart 61 shows the daily Bank of America Merrill Lynch US High Yield Master II Index yield, the 30 year U.S. Treasury yield and the spread between the two from December 31, 2015.
- Chart 62 shows the daily Bank of America Merrill Lynch US High Yield CCC and Below yield, the 30 year U.S. Treasury yield and the spread between the two from December 31, 2015.
- Chart 63 shows the daily Bank of America Merrill Lynch US High Yield Master II Index yield, the Bank of America Merrill Lynch US Corporate Master Index yield and the spread between the two from December 31, 2015.
- Chart 64 shows the daily Bank of America Merrill Lynch US High Yield CCC and Below yield, the Bank of America Merrill Lynch US Corporate Master Index yield and the spread between the two from December 31, 2015.
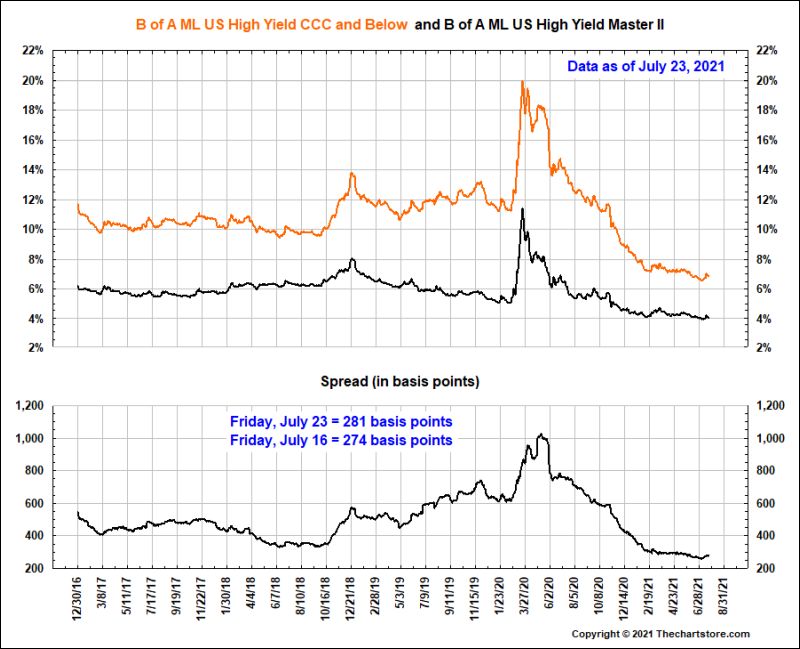
- Chart 65 shows the daily Bank of America Merrill Lynch US High Yield CCC and Below yield, the Bank of America Merrill Lynch US High Yield Master II Index yield and the spread between the two from December 31, 2015.
- Chart 66 is a swing chart of the daily U.S. Dollar Index (DX) from the May 8, 2014 bottom.
- Chart 67 is a swing chart of the daily Euro from the May 8, 2014 high.
- Chart 68 shows the relative daily price movement of the U.S. Dollar Index (DX) and its six component currencies from December 28, 2016.
- Chart 69 shows the relative daily price movement of eight additional currencies from December 28, 2016.
- Chart 70 shows the relative daily price movement of the U.S. Dollar Index (DX) and six other assets from December 28, 2016.
- Chart 71 is the daily U.S. Dollar Index (DX) with 50 day moving average and Bollinger Bands from December 30, 2016.
- Chart 72 is weekly U.S. Dollar Index (DX) with the MACD indicator since December 28, 2007.
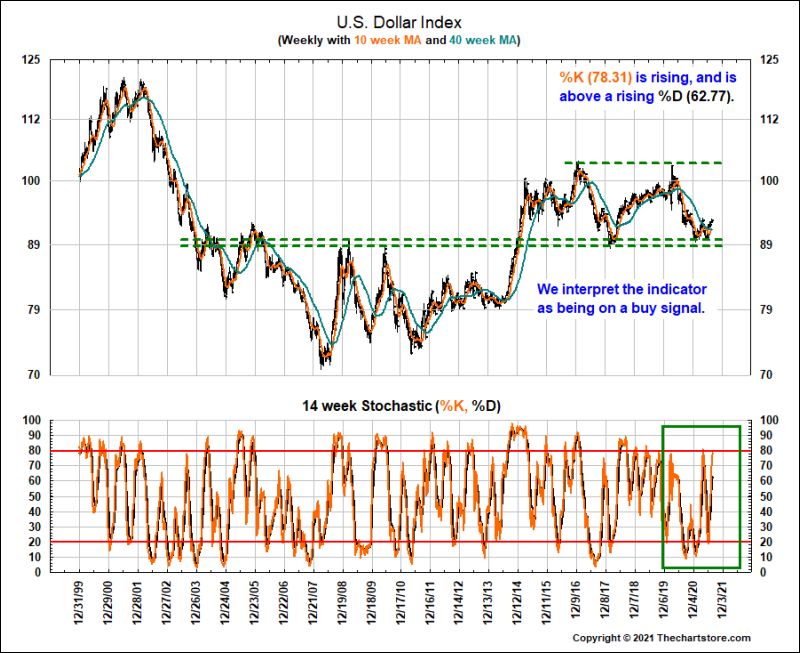
- Chart 73 is weekly U.S. Dollar Index (DX) and the 14 week stochastic since December 31, 1999.
- Chart 74 is a swing chart of the year-to-date percentage moves of the S&P GSCI, Gold, Crude Oil and Copper.
- Chart 75 is the daily S&P GSCI with 50 day moving average and Bollinger Bands from December 30, 2016.
- Chart 76 is the weekly S&P GSCI with the MACD indicator since December 28, 2007.
- Chart 77 is weekly S&P GSCI with the 10 and 40 week moving averages and the 14 week stochastic since December 31, 1999.
- Chart 78 is the relative weekly price movement of the S&P GSCI and the U.S. Dollar Index from June 6, 2017.
- Chart 79 is a swing chart of the daily Gold since December 30, 2010.
- Chart 80 is daily Gold with 50 day moving average and Bollinger Bands from December 30, 2016.
- Chart 81 is weekly Gold with the MACD indicator since December 28, 2007.
- Chart 82 is weekly Gold with the 10 and 40 week moving averages and the 14 week stochastic since December 31, 1999.
- Chart 83 is the relative weekly price movement of Gold and the U.S. Dollar Index from June 6, 2017.
- Chart 84 is daily Silver with 50 day moving average and Bollinger Bands from December 30, 2016.
- Chart 85 is weekly Silver with the MACD indicator since December 28, 2007.
- Chart 86 is weekly Silver with the 10 and 40 week moving averages and the 14 week stochastic since December 28, 2001.
- Chart 87 is daily Crude Oil with 50 day moving average and Bollinger Bands from December 30, 2016.
- Chart 88 is weekly Crude Oil with the MACD indicator since December 28, 2007.
- Chart 89 is weekly Crude Oil with the 10 and 40 week moving averages and the 14 week stochastic since December 28, 2001.
- Chart 90 is weekly Crude Oil and U.S. Rig Counts from December 28, 2007.
- Chart 91 is the relative weekly price movement of Crude Oil and the U.S. Dollar Index from June 6, 2017.
- Chart 92 is daily Comex Copper with 50 day moving average and Bollinger Bands from December 30, 2016.
- Chart 93 is weekly Comex Copper with the MACD indicator since December 28, 2007.
- Chart 94 is weekly Copper with the 10 and 40 week moving averages and the 14 week stochastic since December 28, 2001.
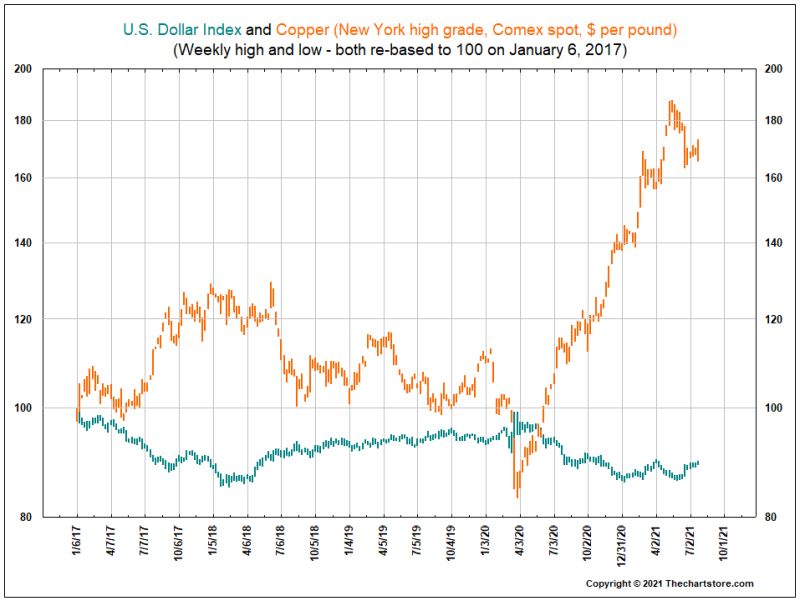
- Chart 95 is the relative weekly price movement of Copper and the U.S. Dollar Index from June 6, 2017.
- Chart 96 is weekly Total Assets of the Federal Reserve System from December 18, 2002.
- Chart 97 is weekly Total Capital of the Federal Reserve System from December 18, 2002.
- Chart 98 is weekly Assets/Capital ratio of the Federal Reserve System from December 18, 2002.
- Chart 99 is the weekly S&P 500 vs. Total Assets of the Federal Reserve System from December 26, 2008.
- Chart 100 is the weekly 10 year U.S. Treasury vs. Total Assets of the Federal Reserve System from December 26, 2008.
- Chart 101 is weekly Gold vs. Total Assets of the Federal Reserve System from December 26, 2008.
- Chart 102 is weekly Total Assets of the Federal Reserve System from October 29, 2014 (the end of QE - 3).
- Chart 103 is the Rolling 4 Week Change of Total Assets of the Federal Reserve System from December 18, 2002.
- Chart 104 is weekly Securities held by All Federal Reserve Banks from December 18, 2002.
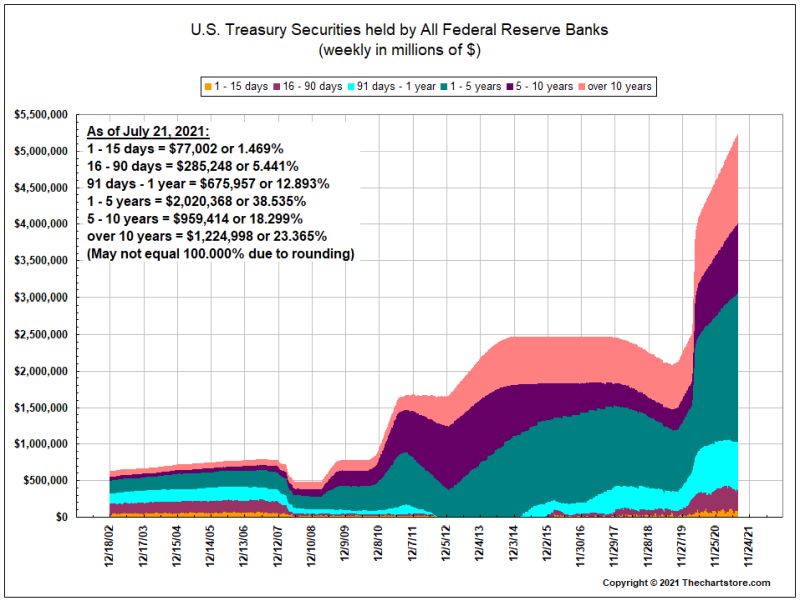
- Chart 105 is weekly U.S. Treasury Securities held by All Federal Reserve Banks from December 18, 2002.
- A statistical summary of Housing Permits and Starts.
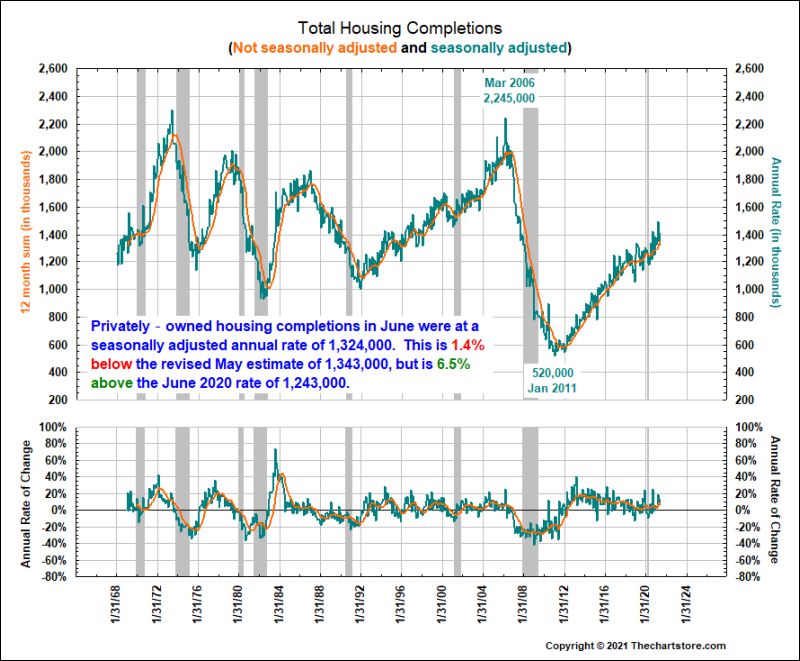
- Charts 106 through 108 review Housing Permits, Housing Starts, Housing Completions from as early as 1946.
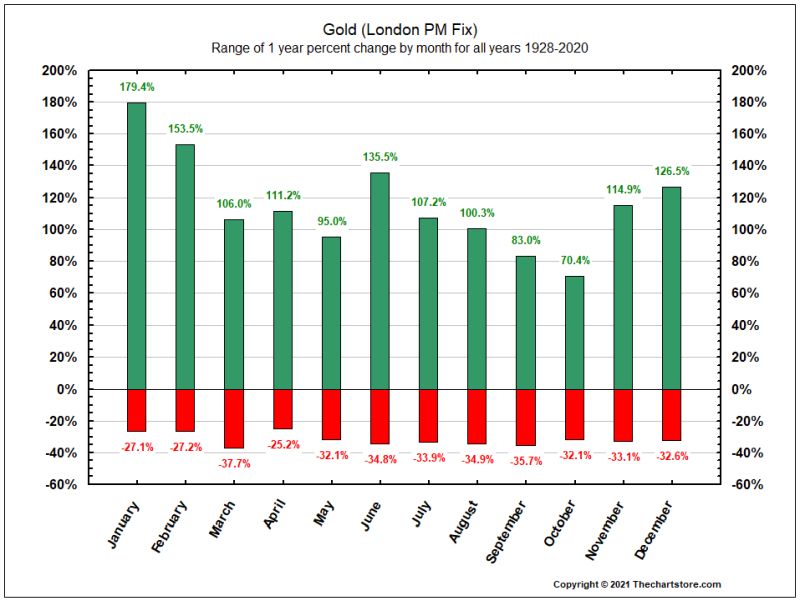
- Charts 109 through 114 review London PM Gold monthly and yearly returns from 1968 to 2020.
For the Weekly Scoreboard in .pdf format, click here.
Major U.S. Stock Index Watch
Chart 1
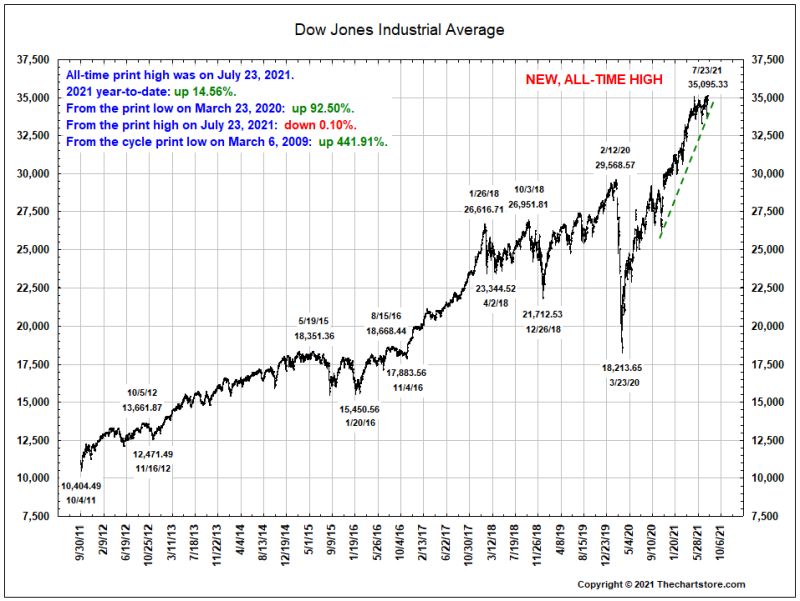
Chart 2
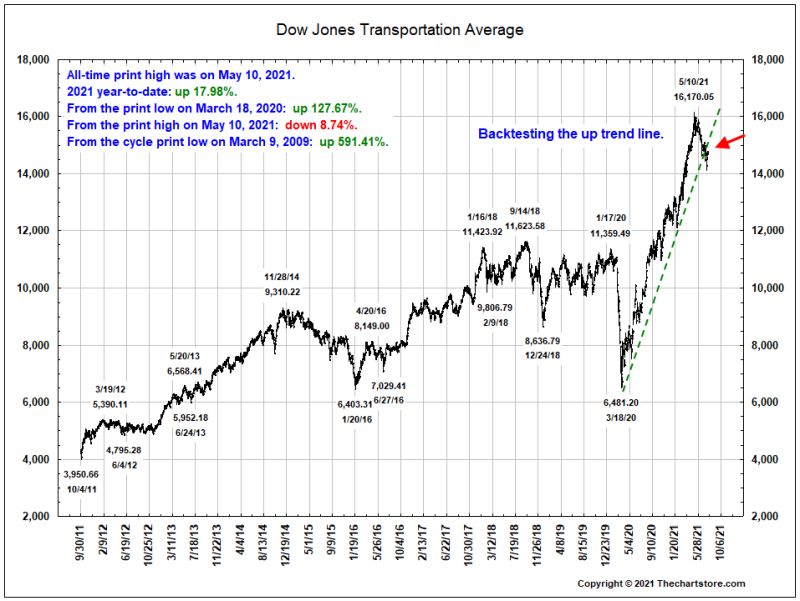
Chart 3
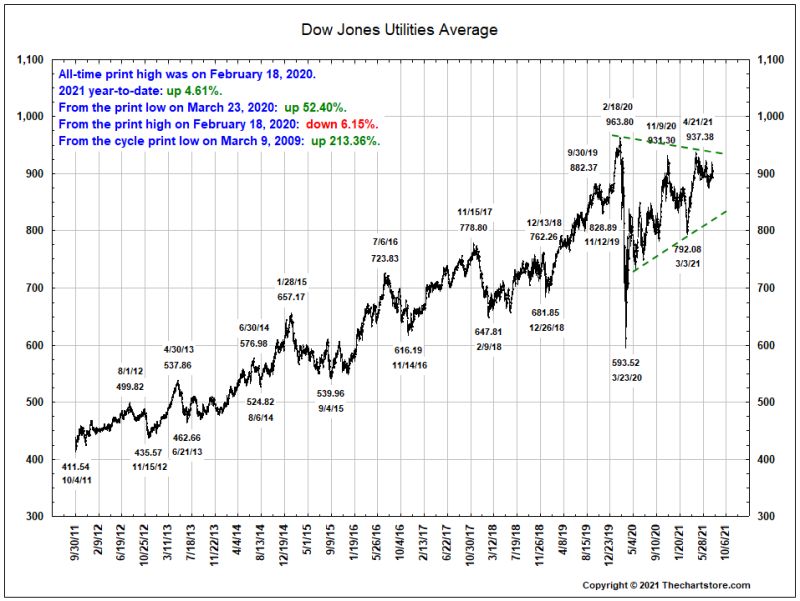
Chart 4
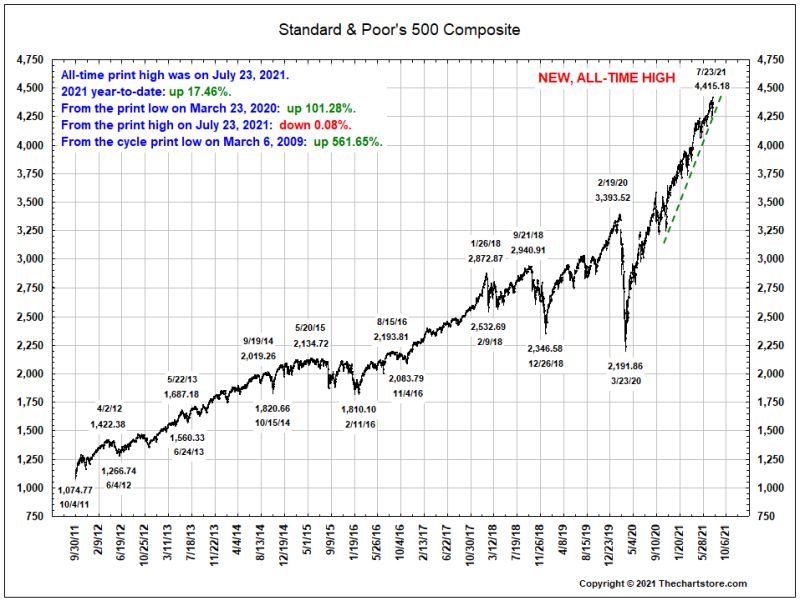
Chart 5
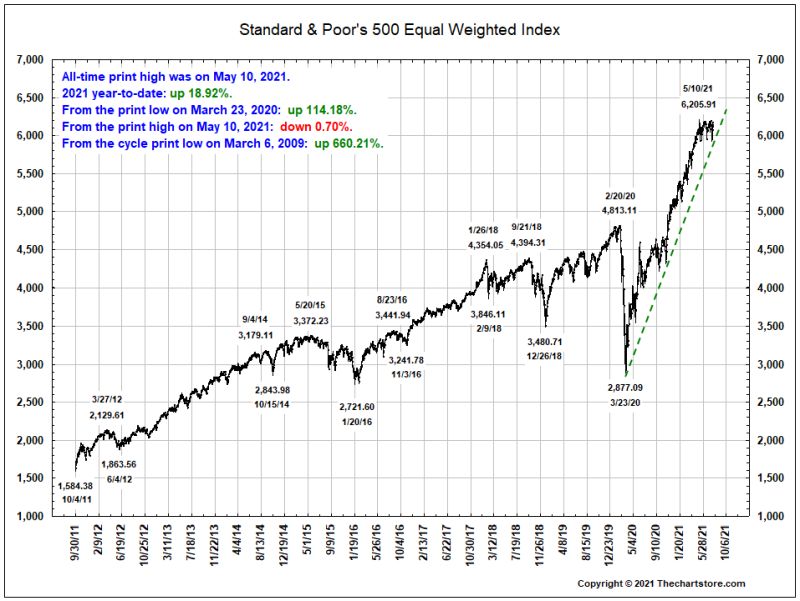
Chart 6
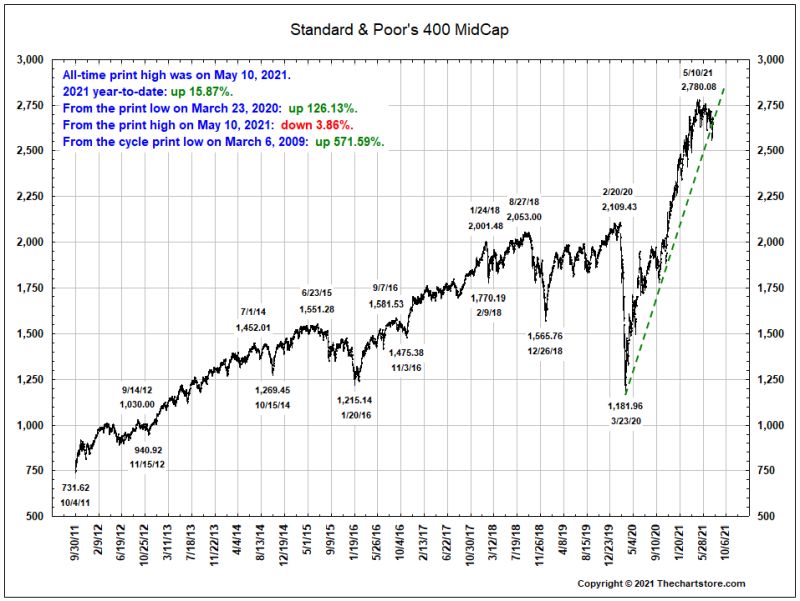
Chart 7
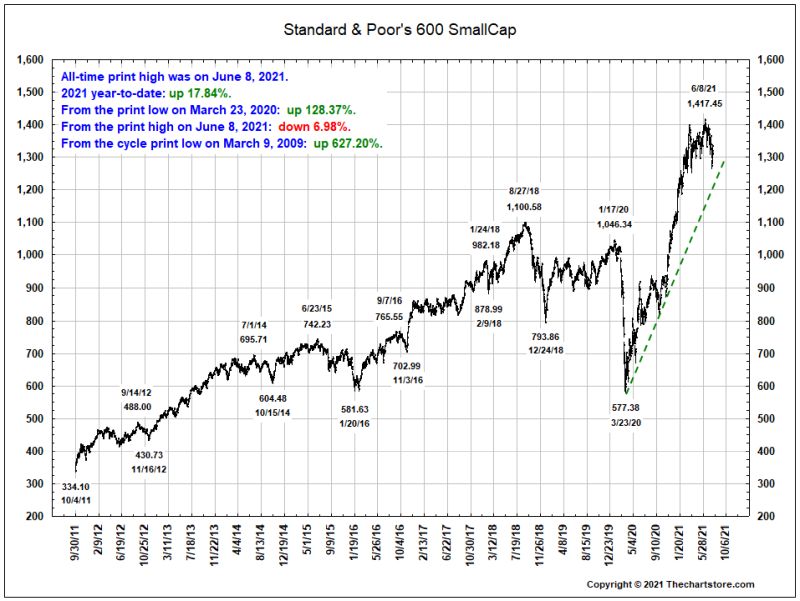
Chart 8
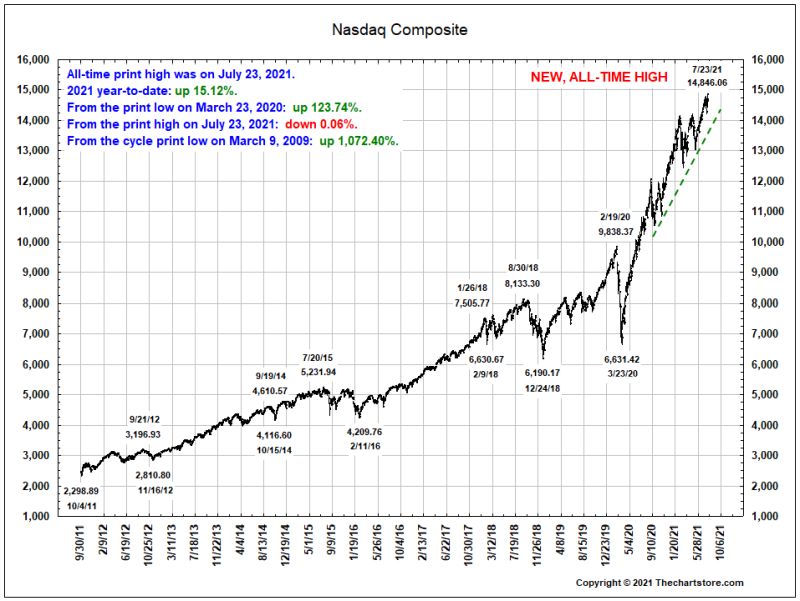
Chart 9
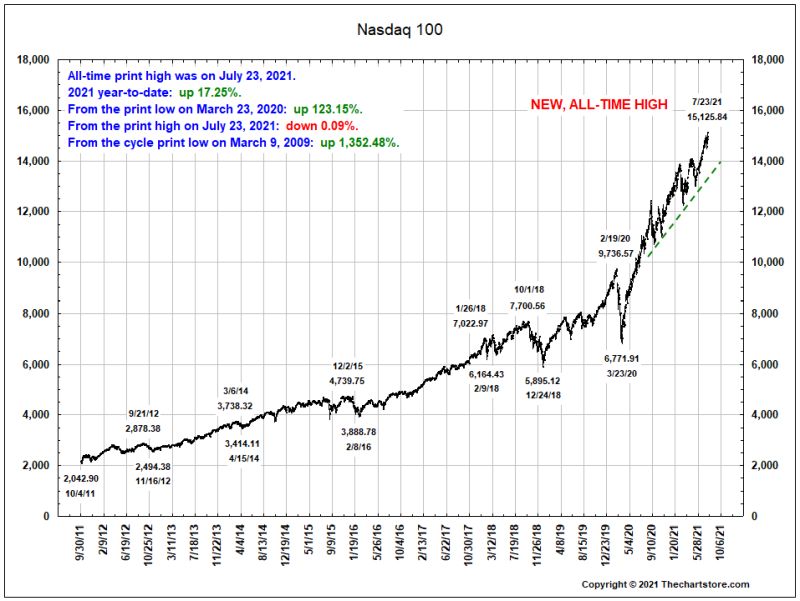
Chart 10
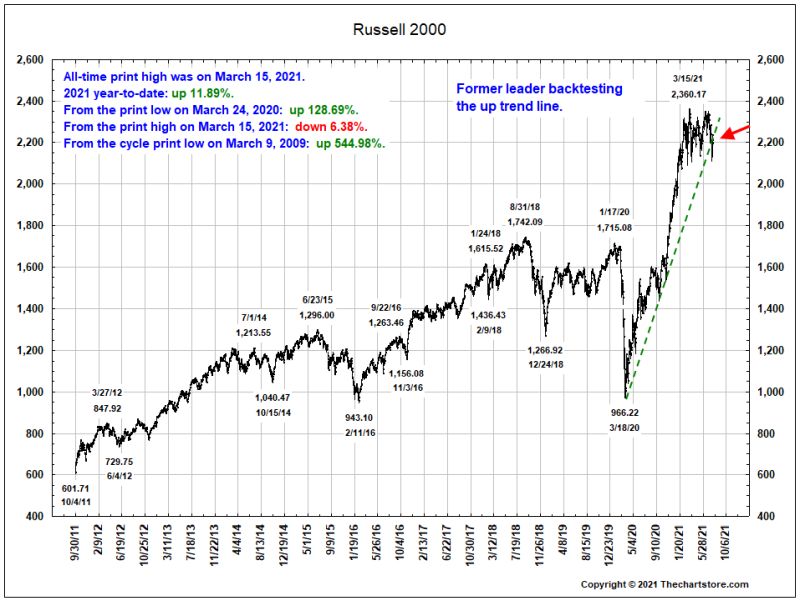
Chart 11
S&P GICS Sector Watch
Chart 12
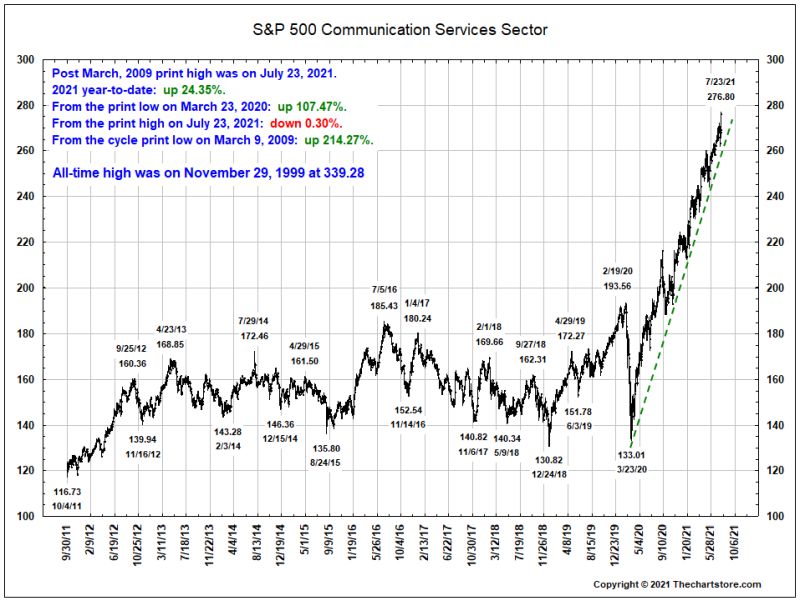
Chart 13
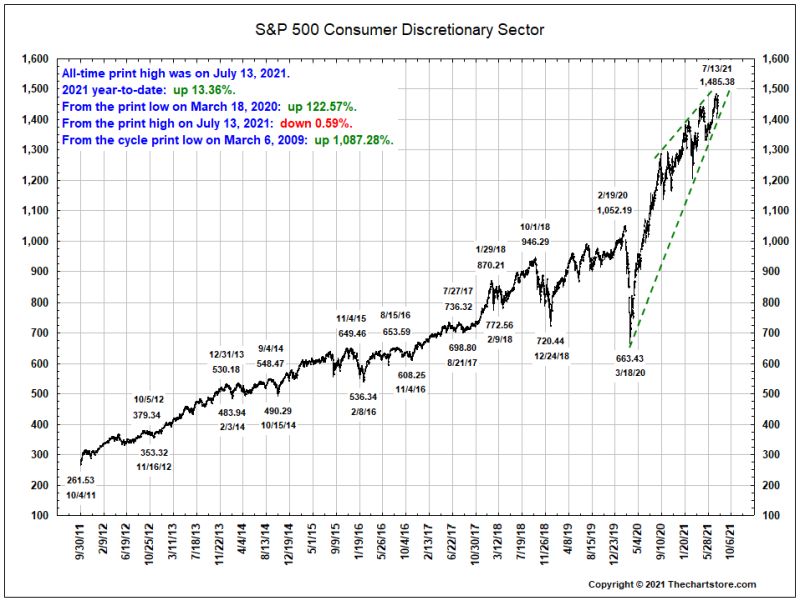
Chart 14
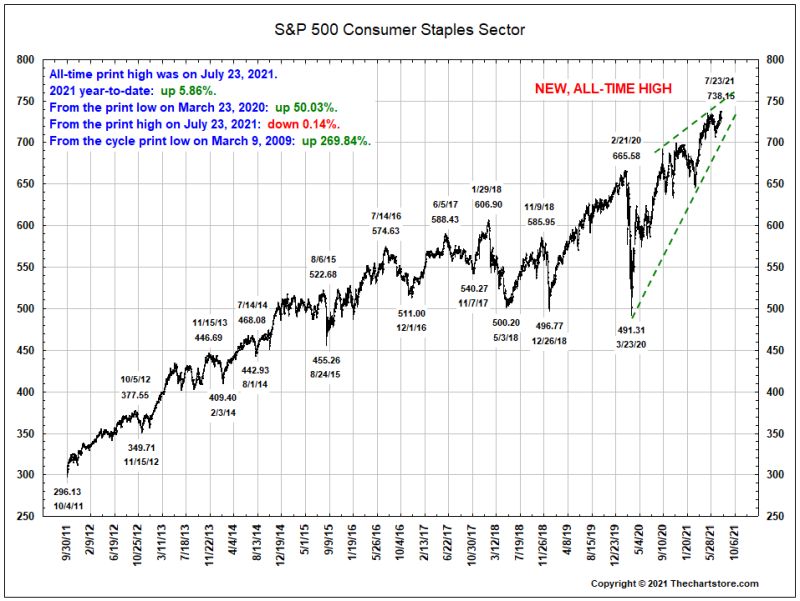
Chart 15
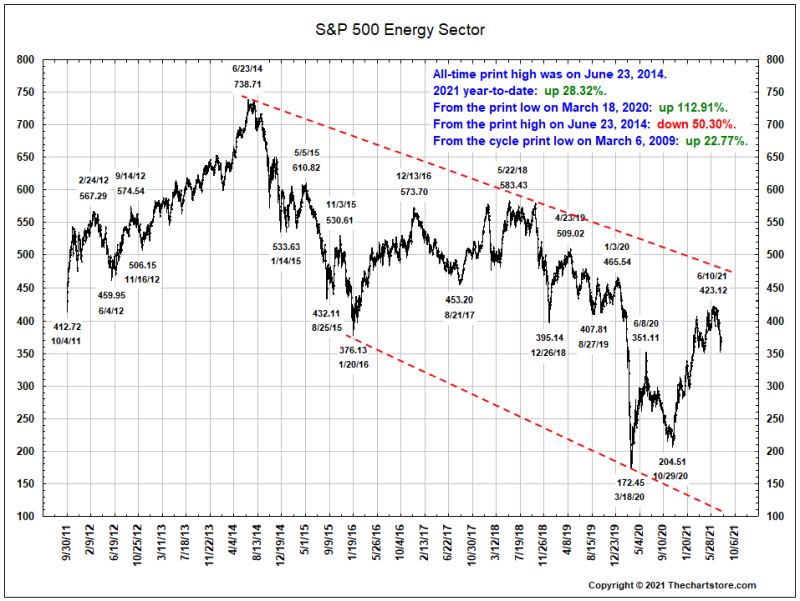
Chart 16
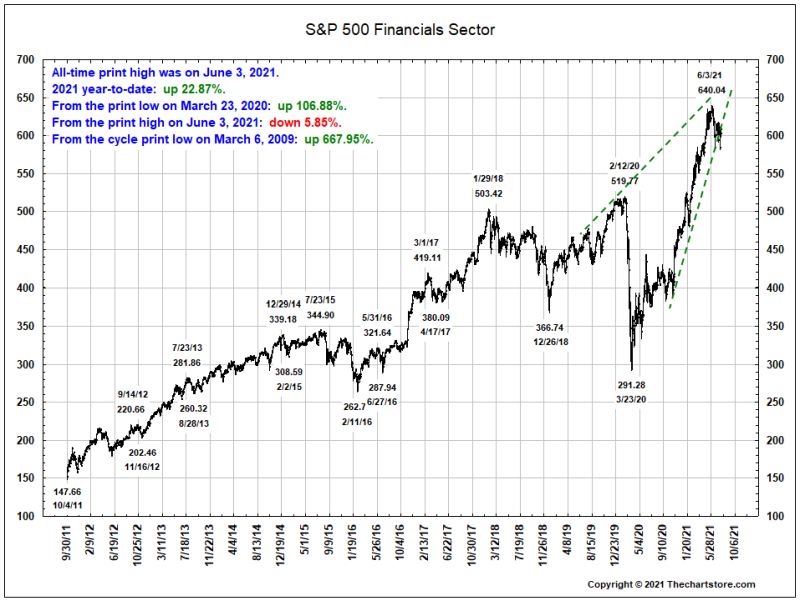
Chart 17
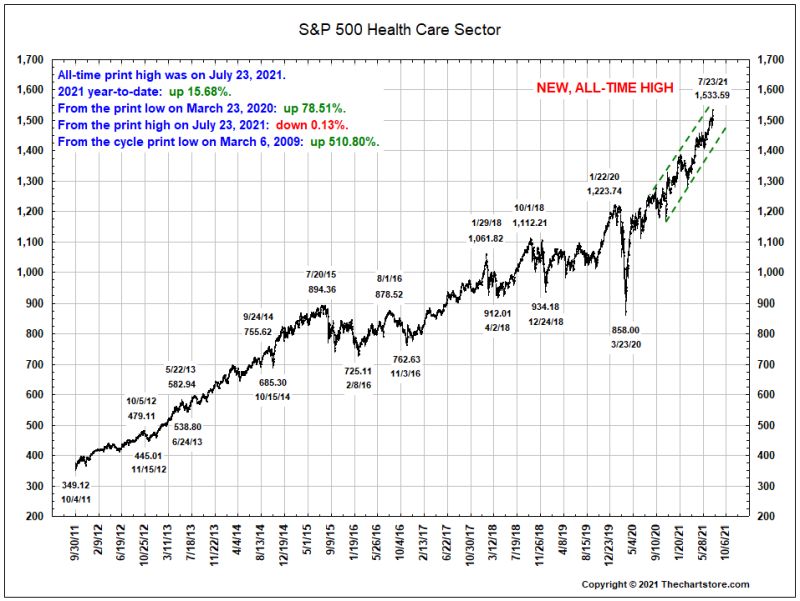
Chart 18
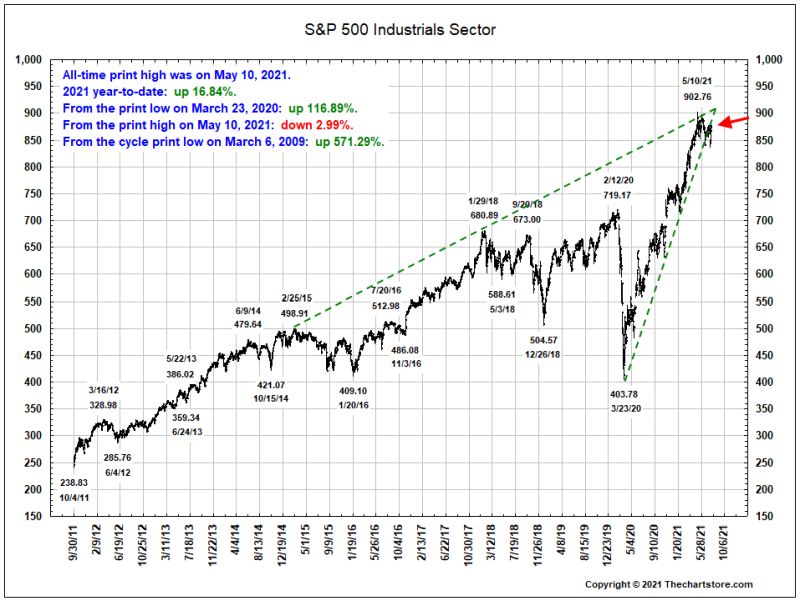
Chart 19
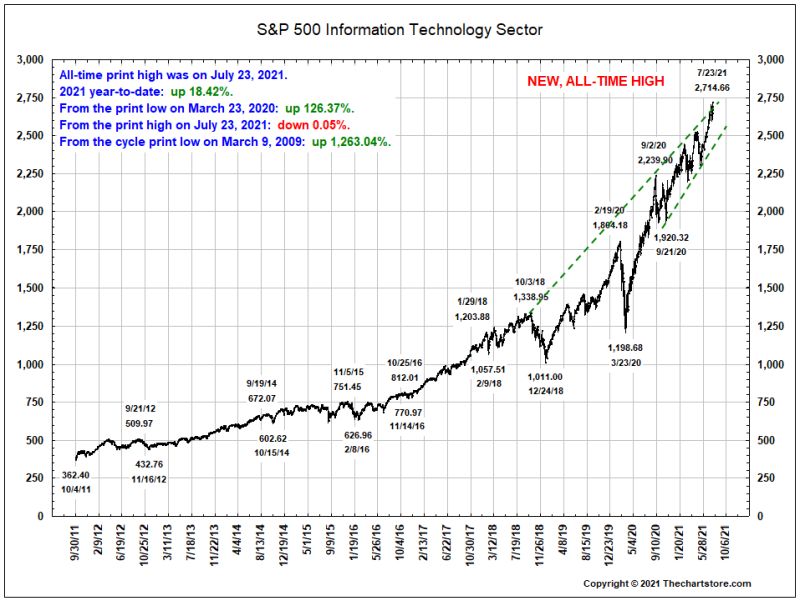
Chart 20
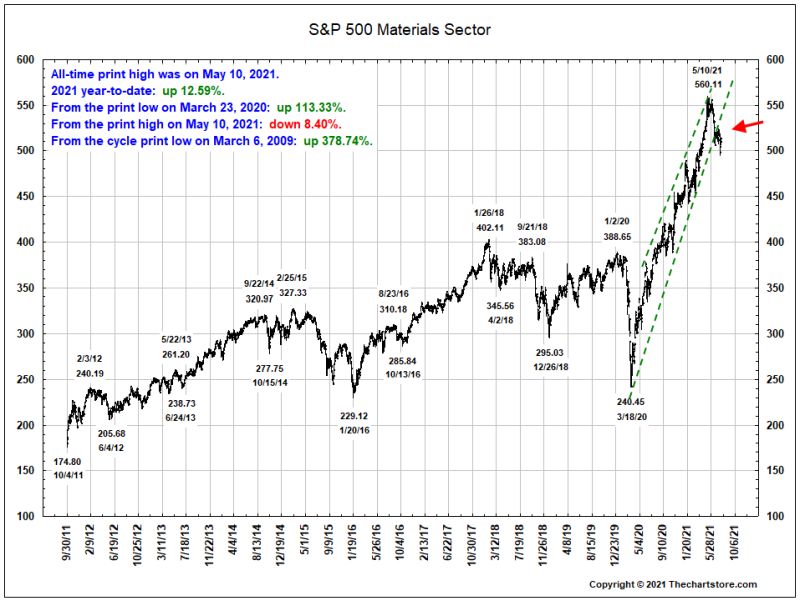
Chart 21
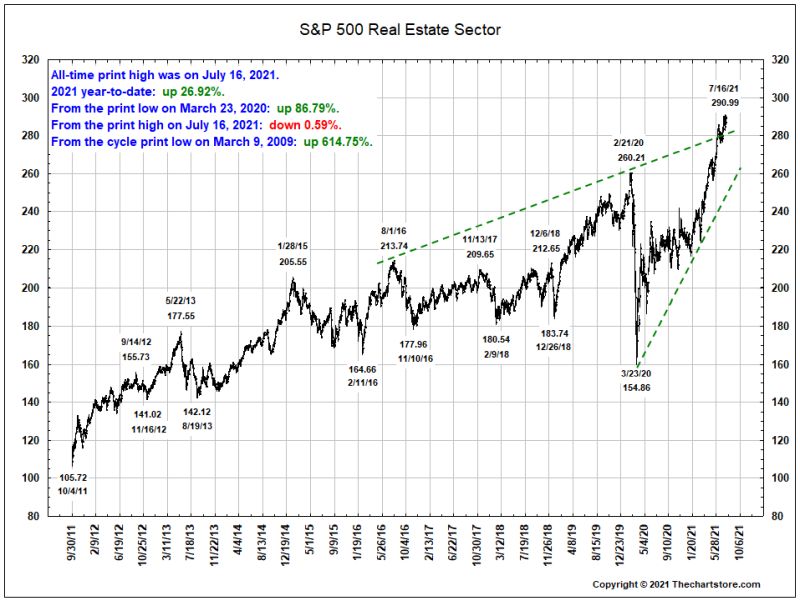
Chart 22
Stock Market Indicator Watch
Chart 23
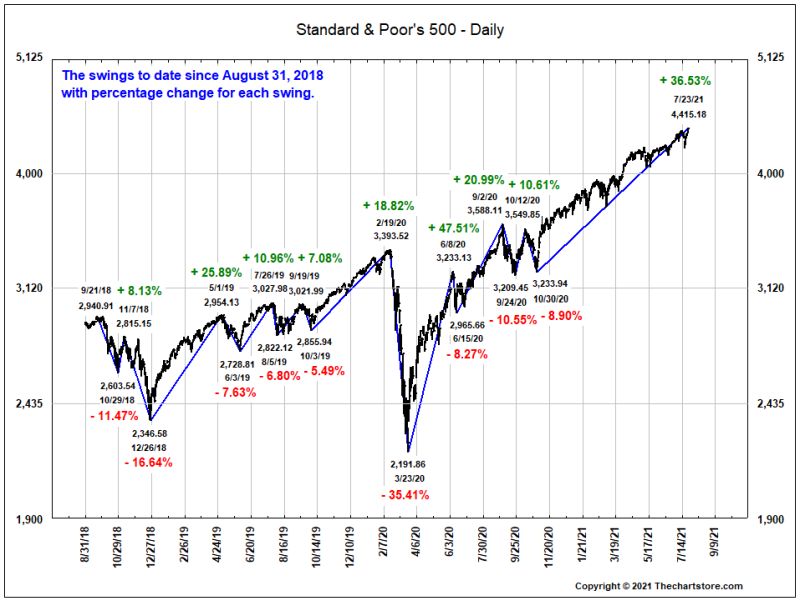
Chart 24
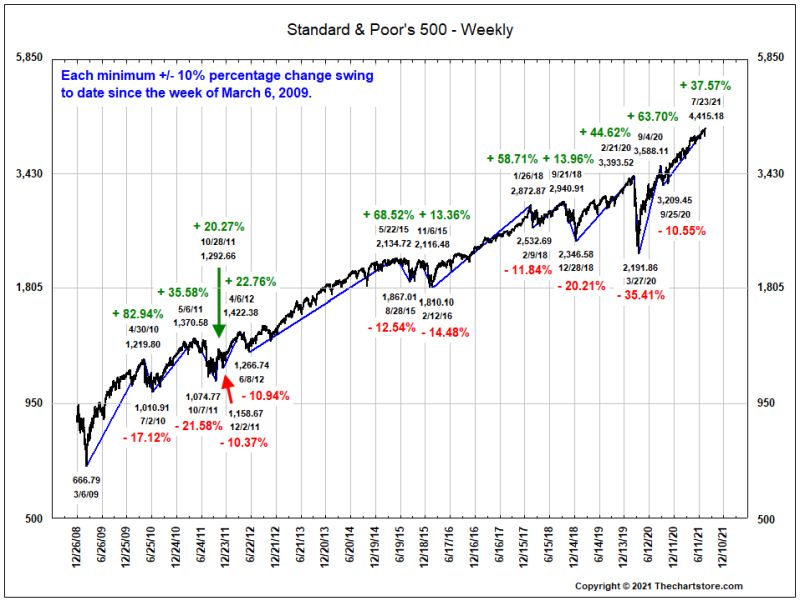
Chart 25
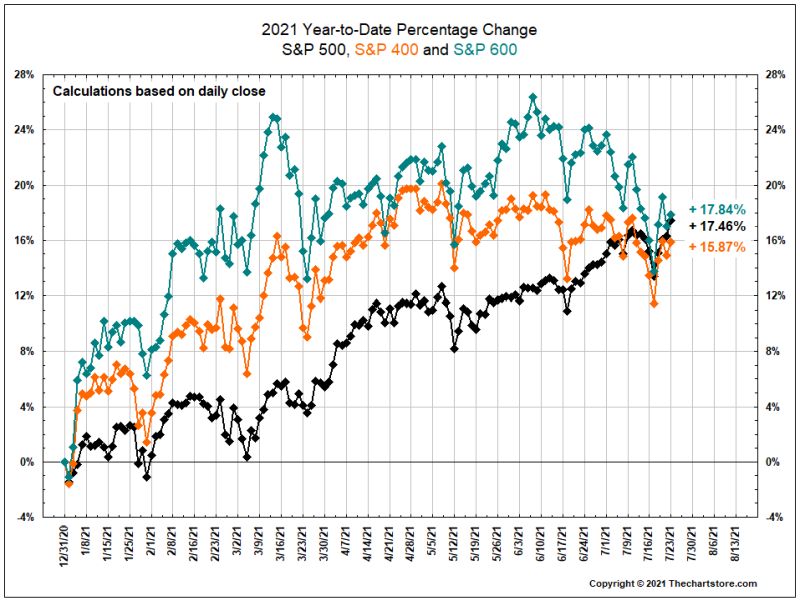
Chart 26
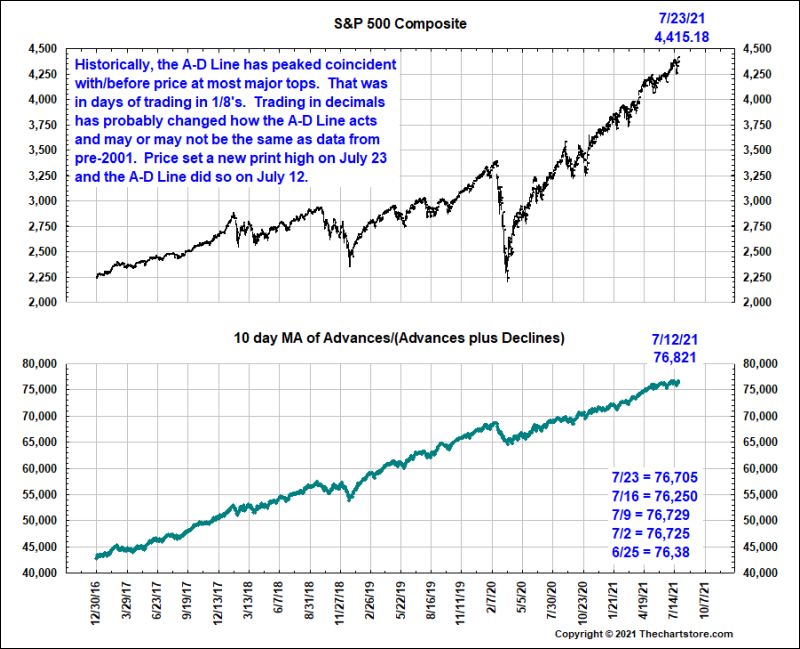
Chart 27
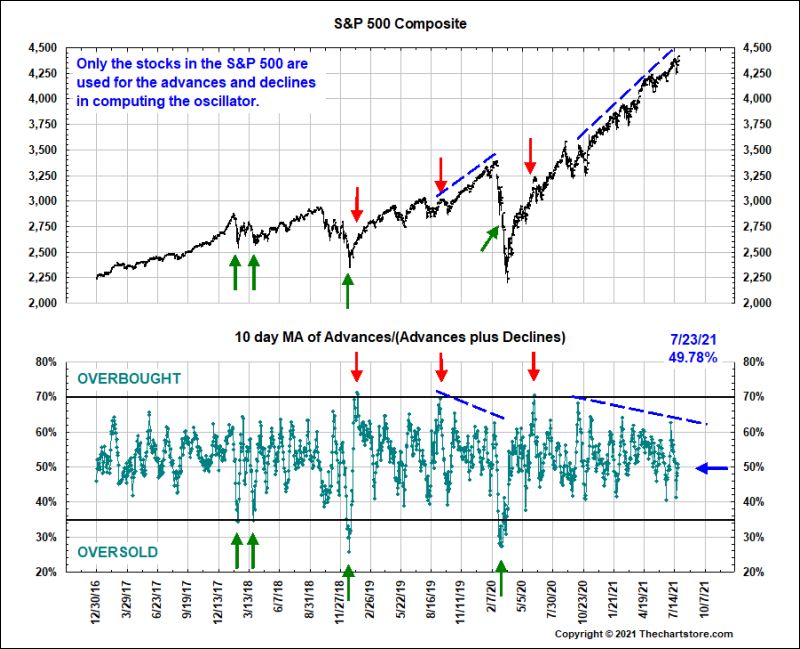
Chart 28
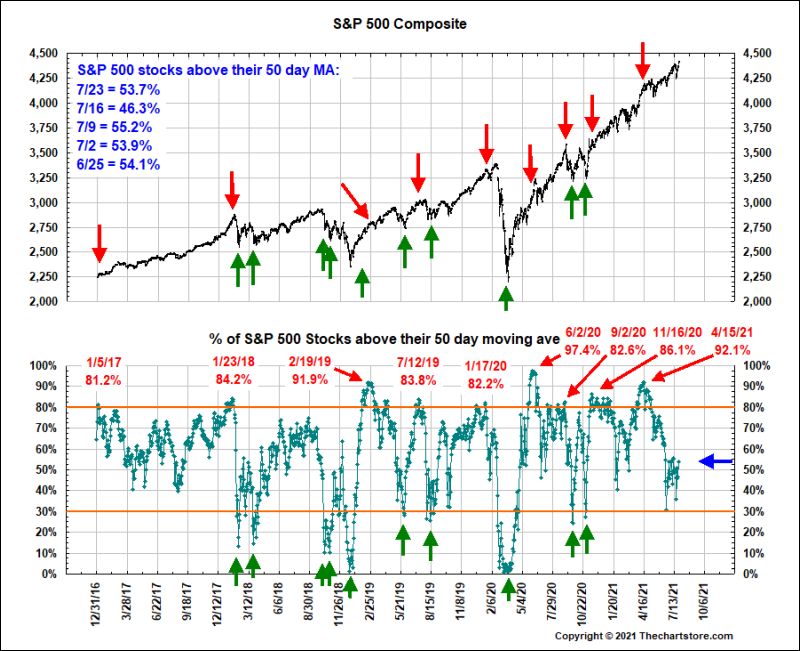
Chart 29
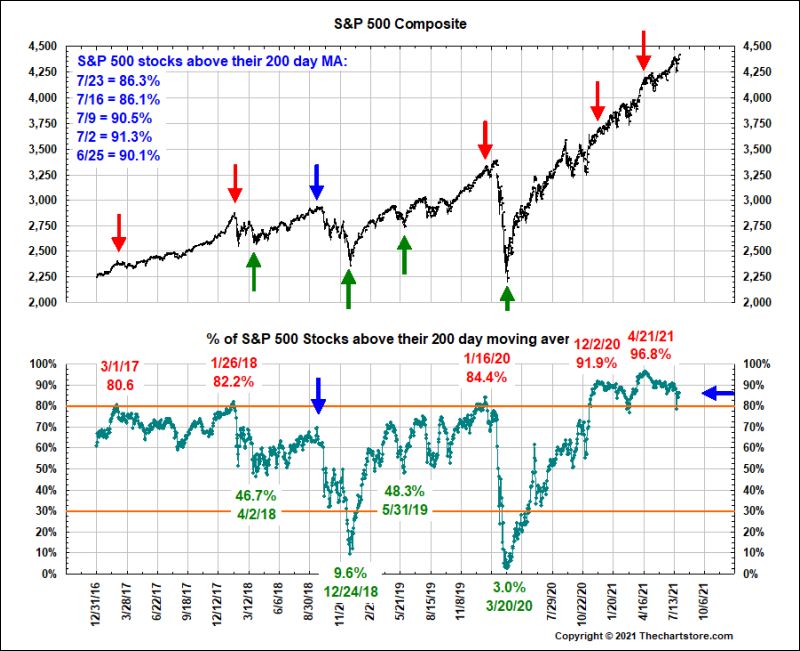
Chart 30
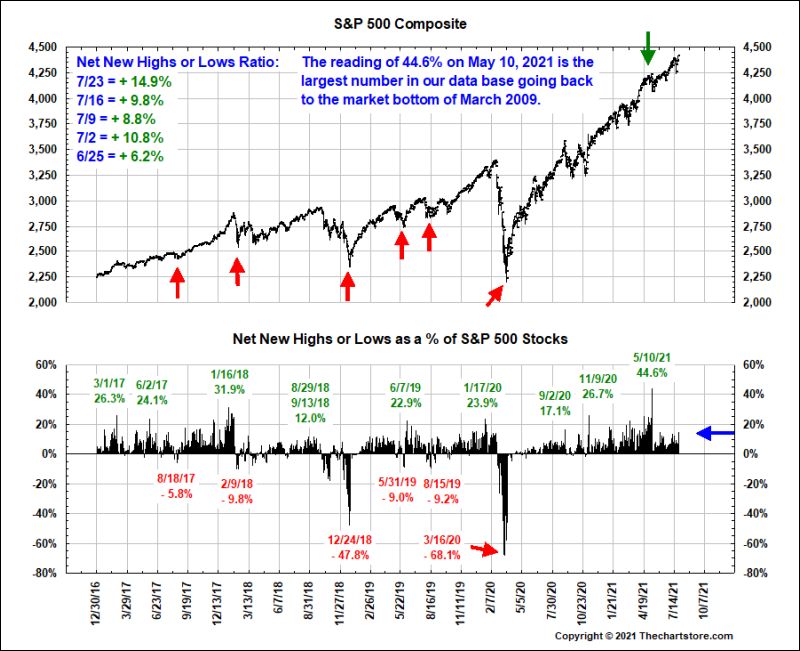
Chart 31
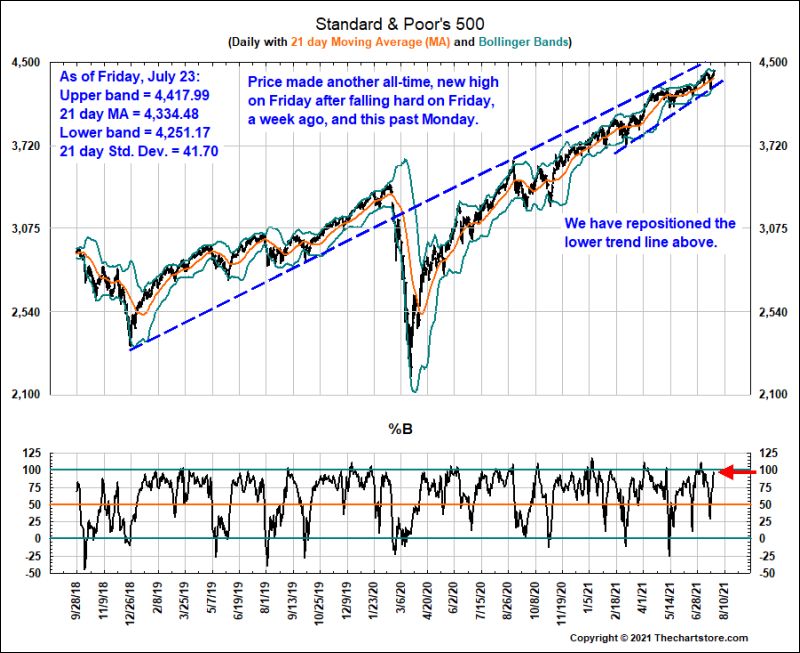
Chart 32
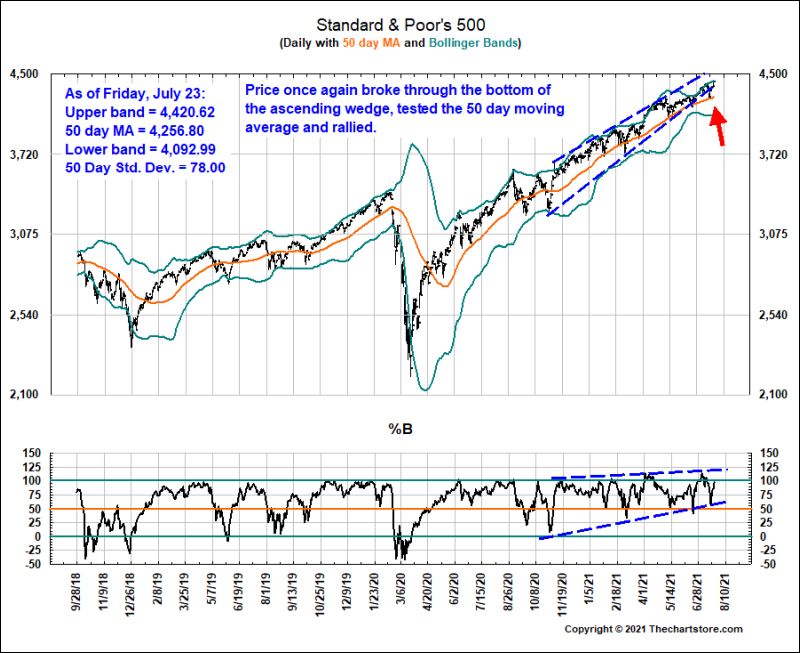
Chart 33
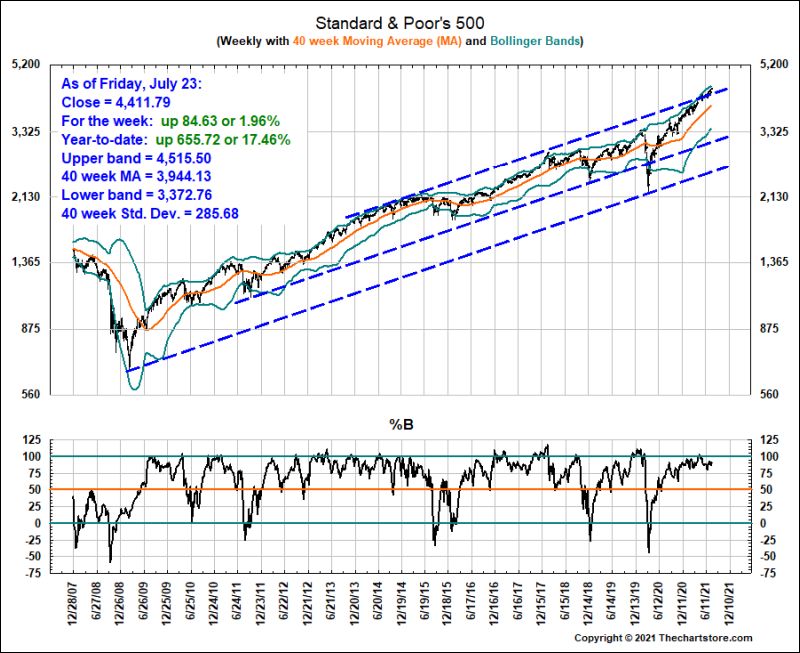
Chart 34
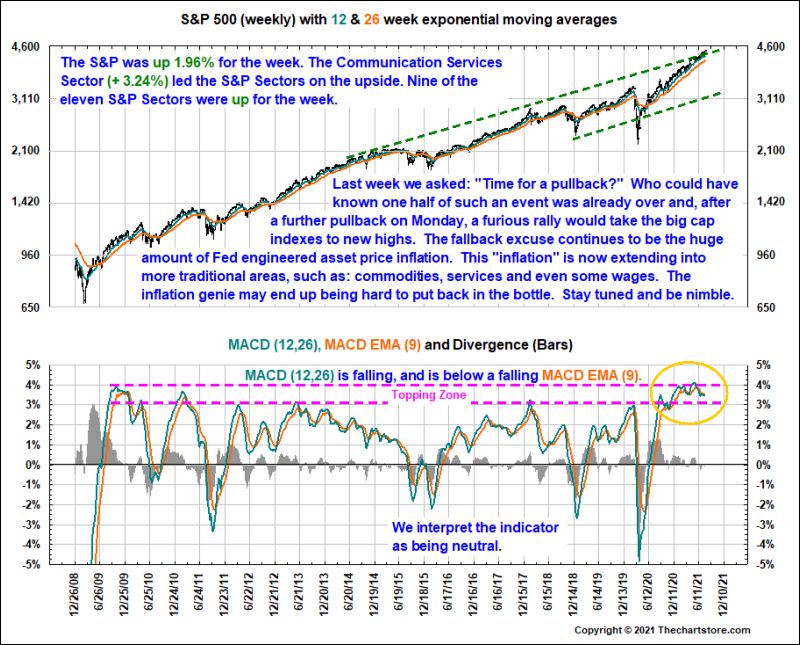
Chart 35
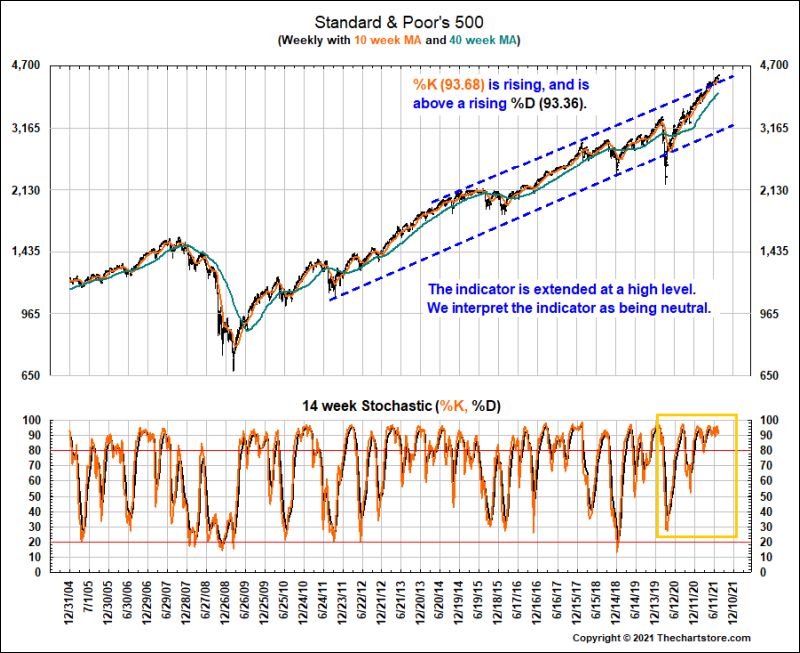
Chart 36
Analog Chart Watch
Chart 37
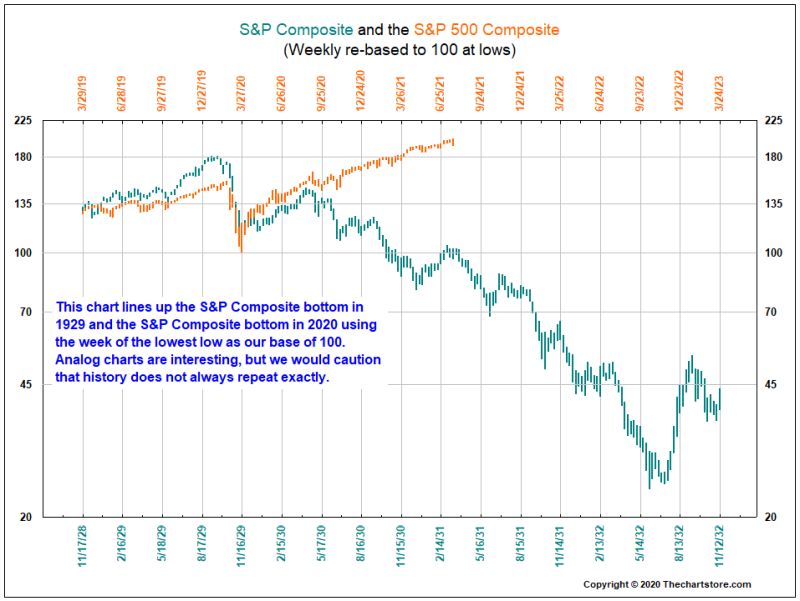
Chart 38
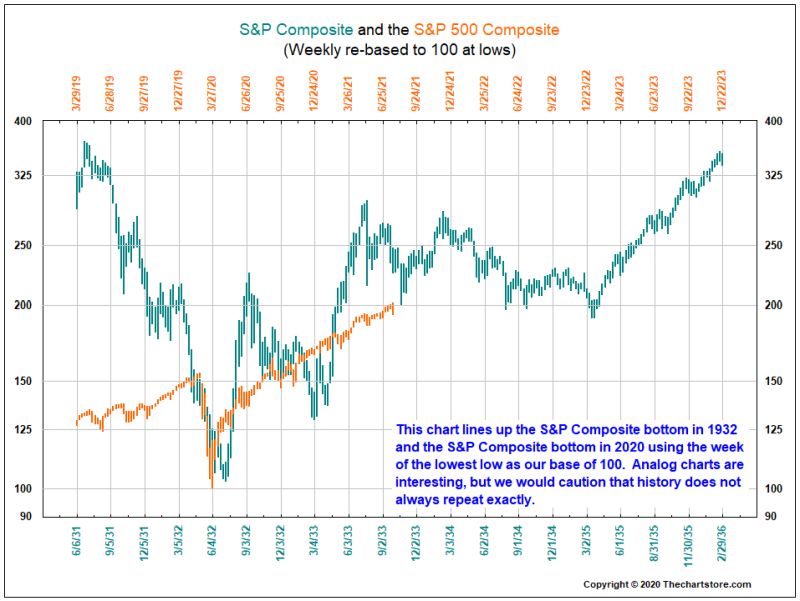
Chart 39
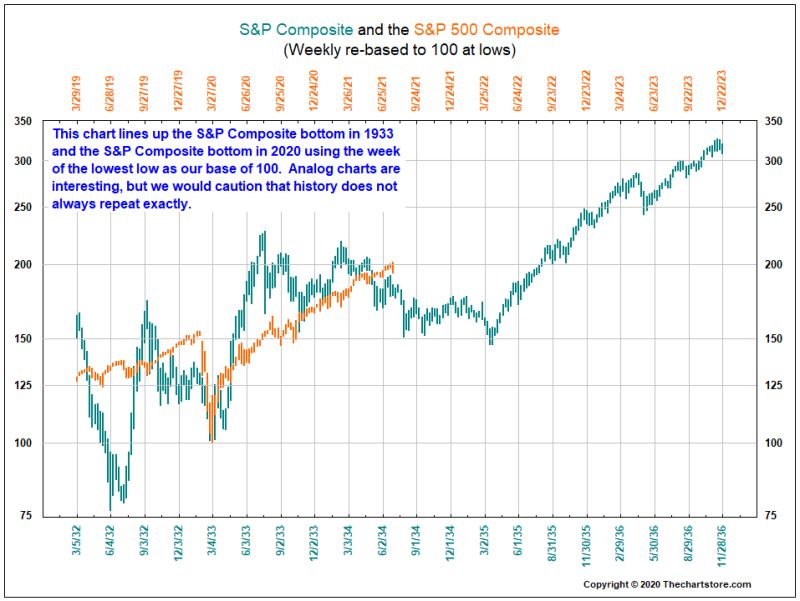
Chart 40
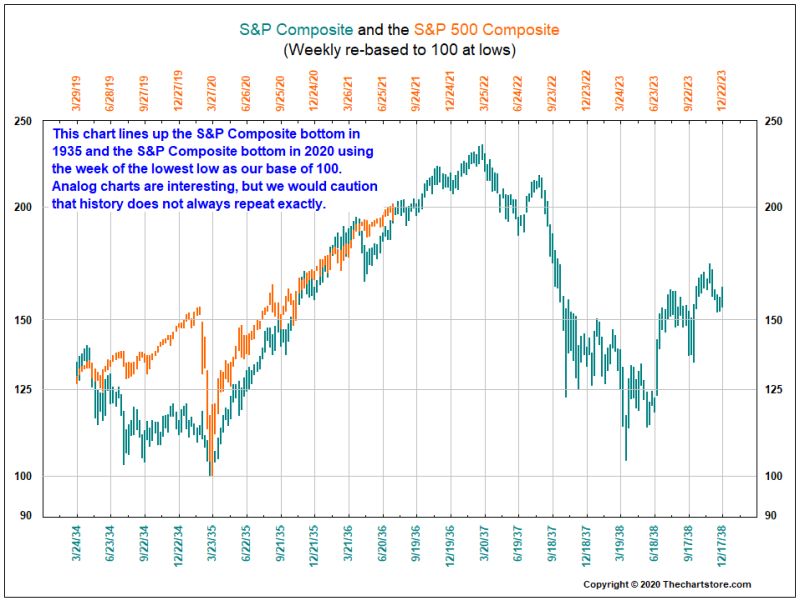
Chart 41
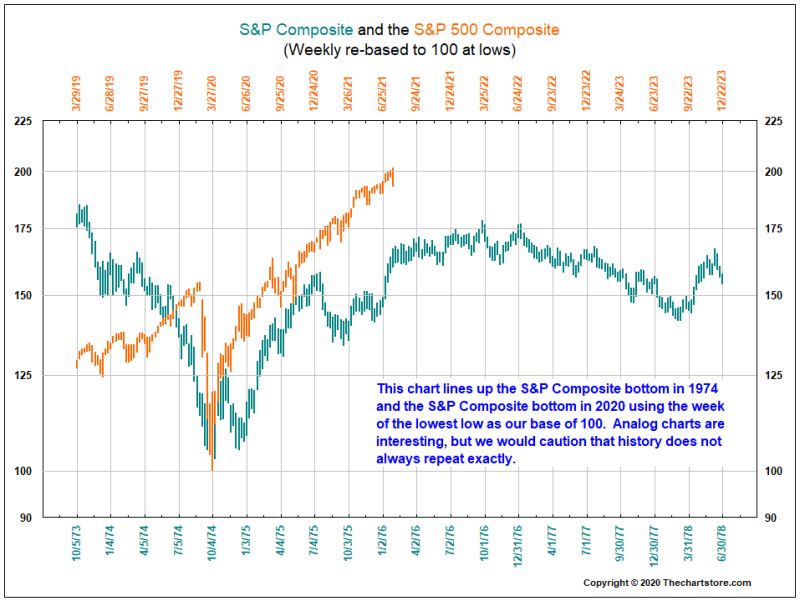
Chart 42
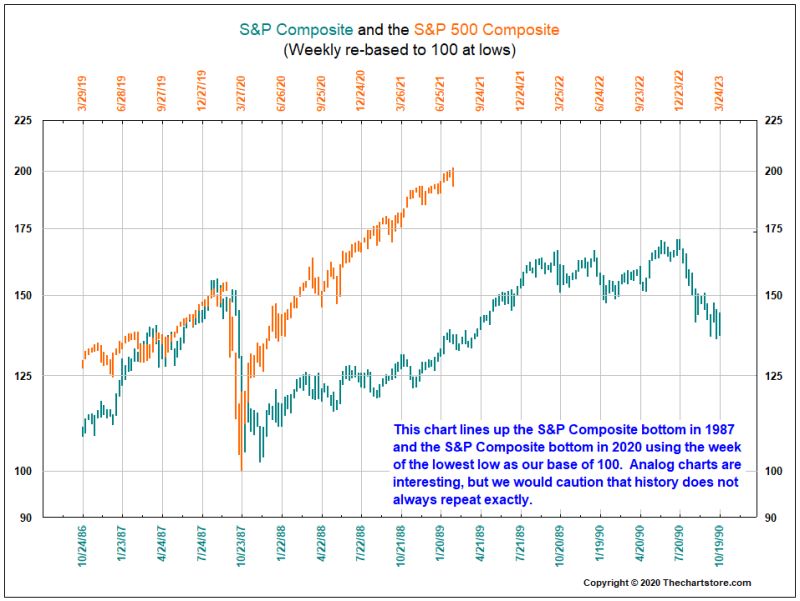
Chart 43
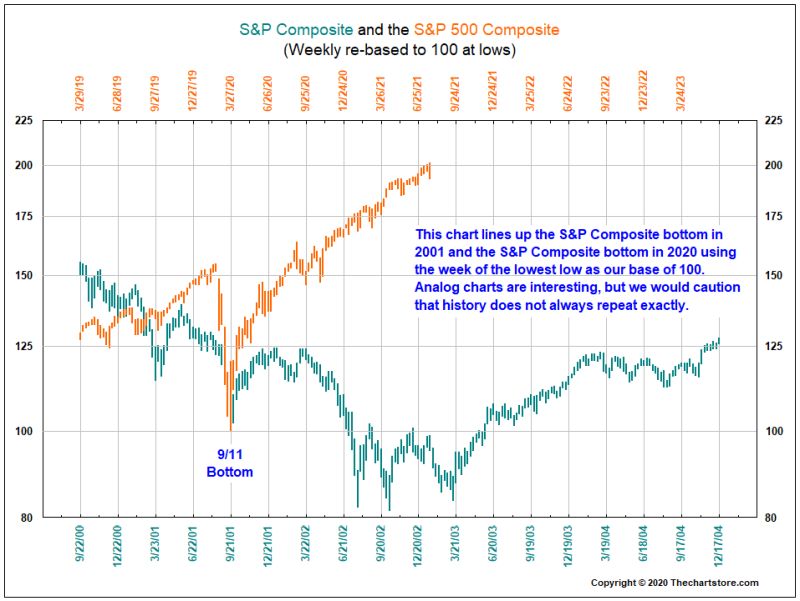
Chart 44
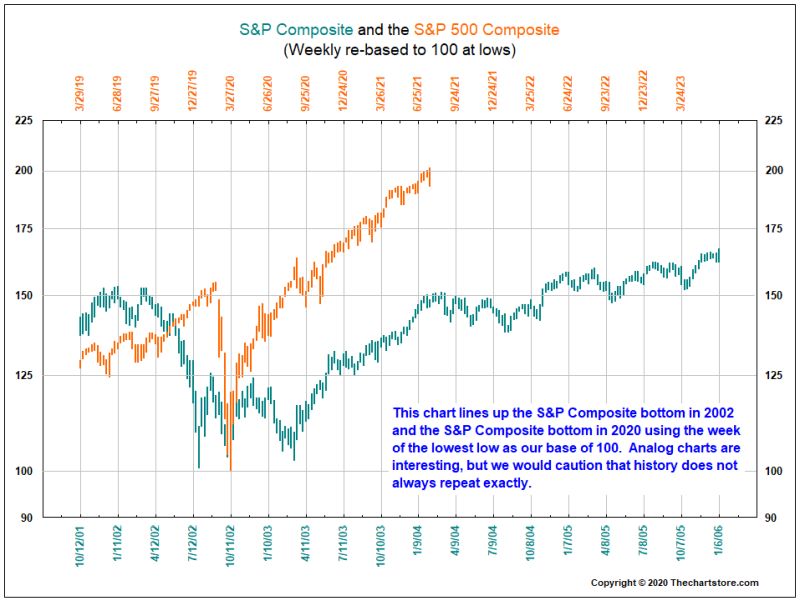
Chart 45
Interest Rate Watch
Chart 46
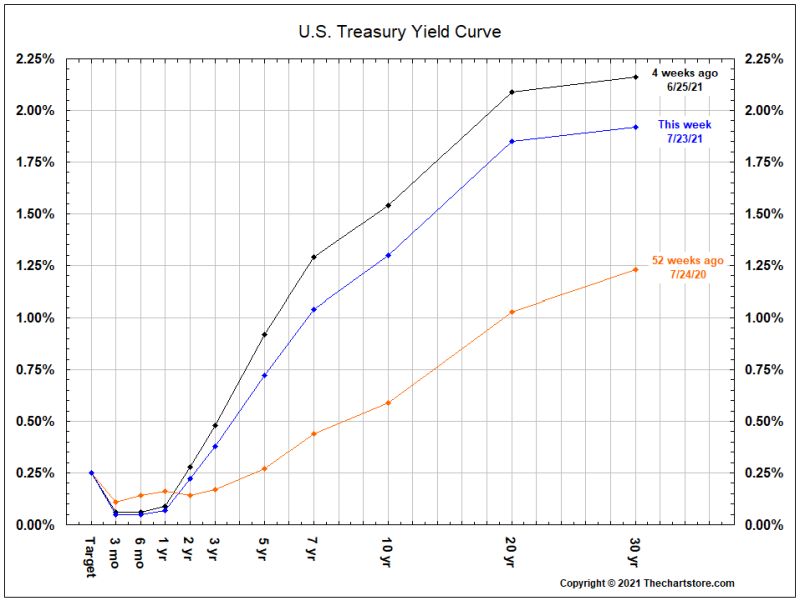
Chart 47
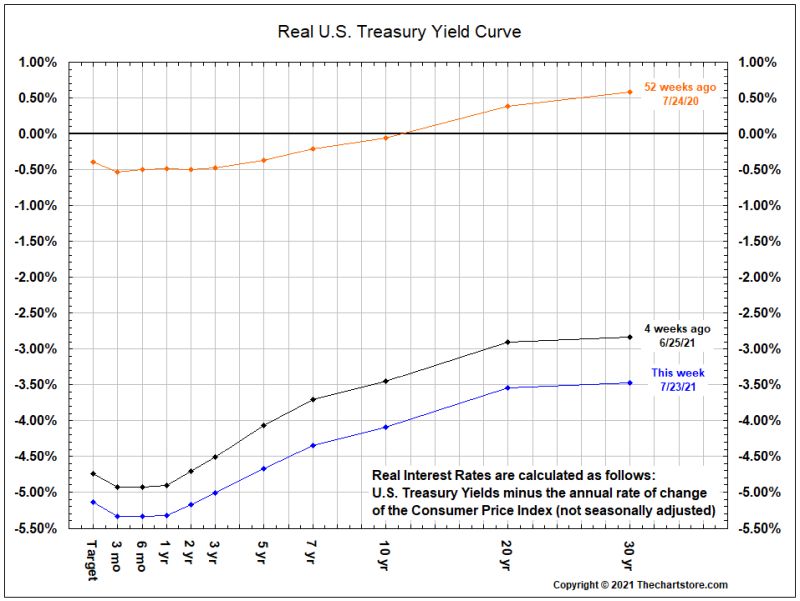
Chart 48
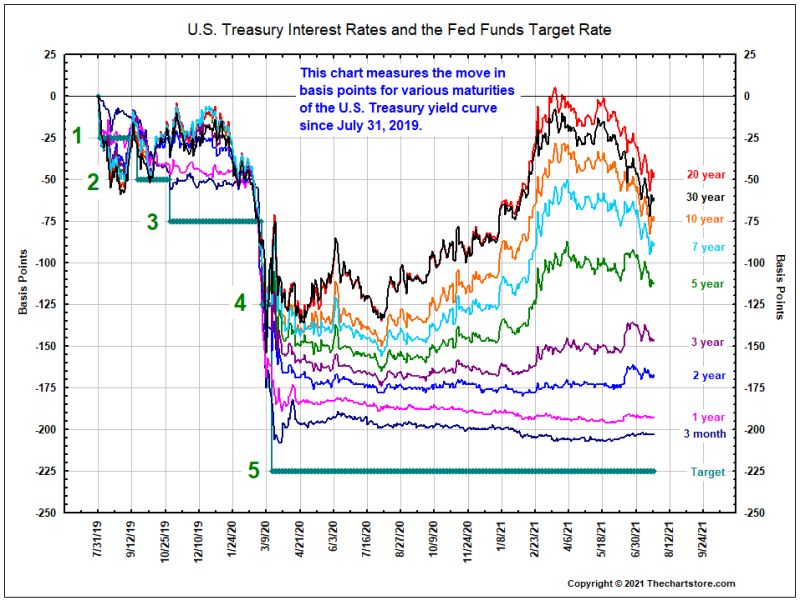
Chart 49
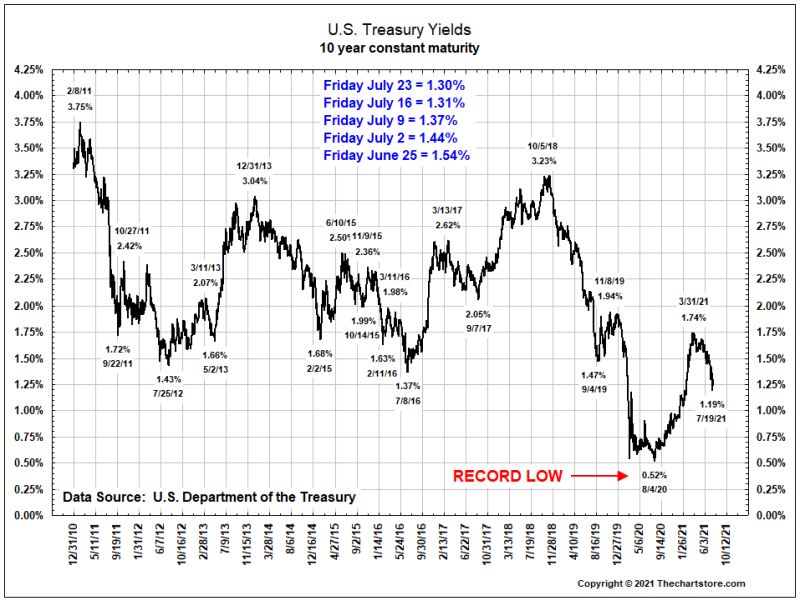
Chart 50
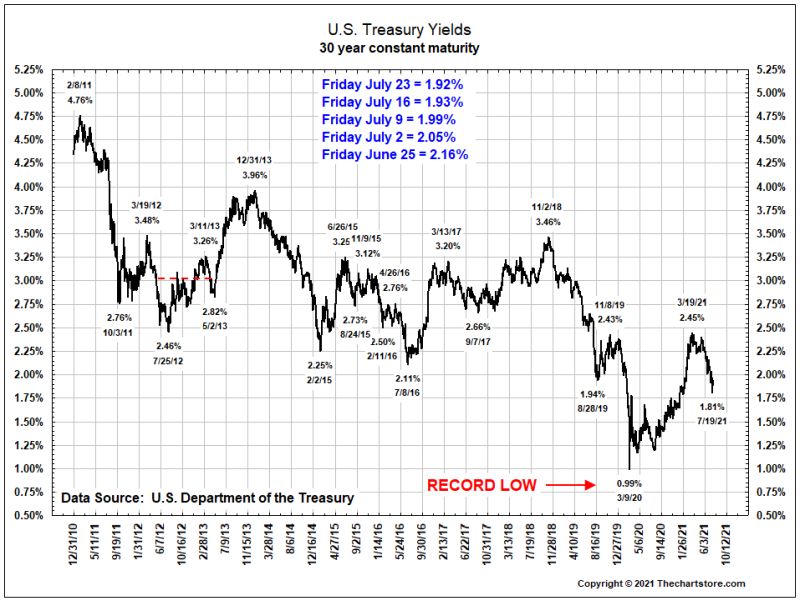
Chart 51
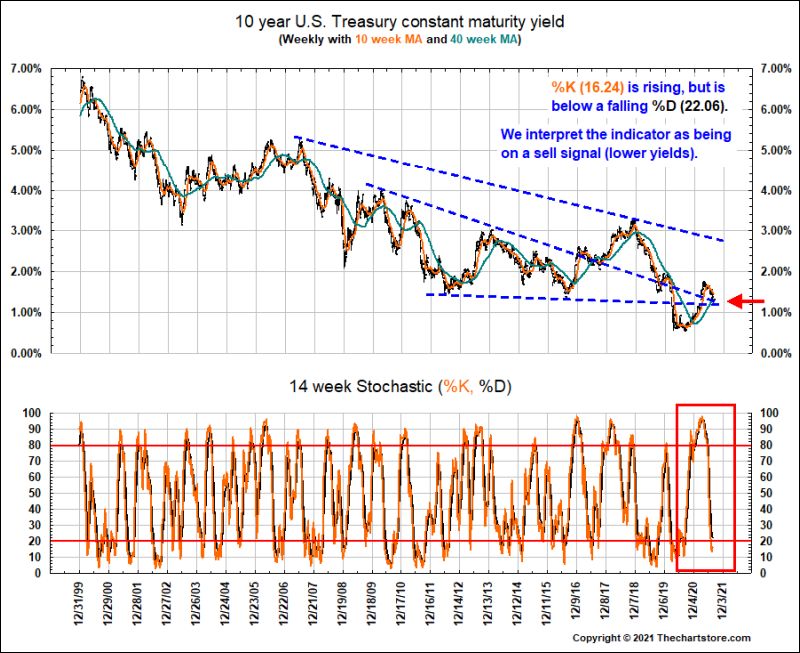
Chart 52
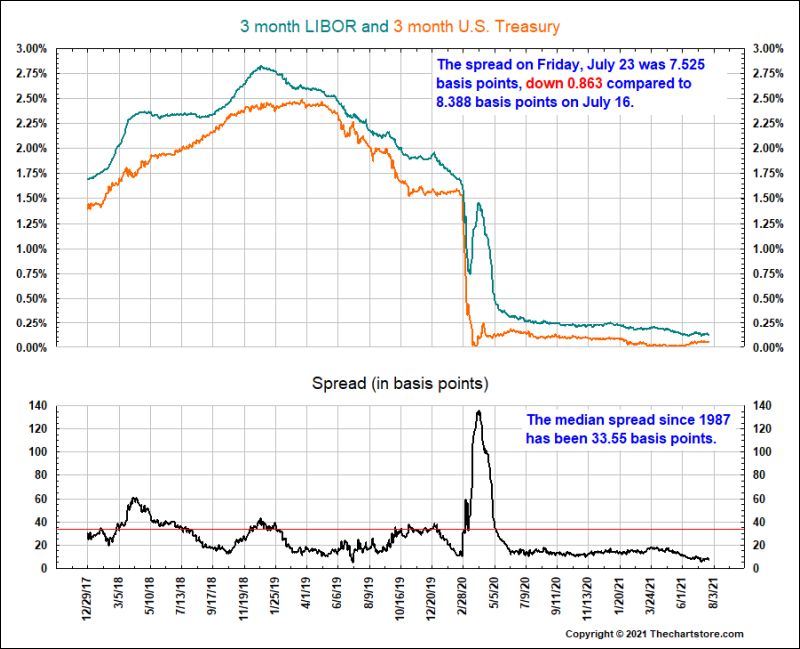
Chart 53
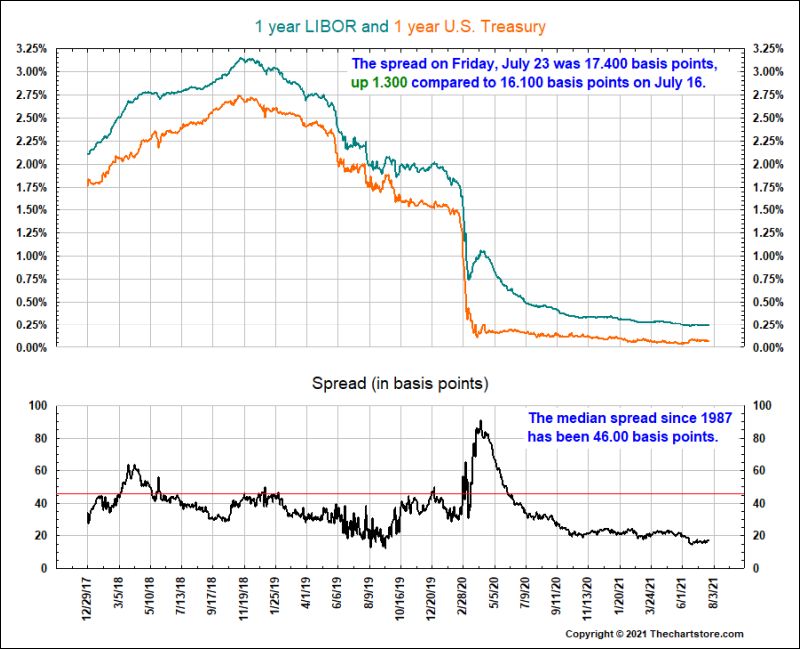
Chart 54
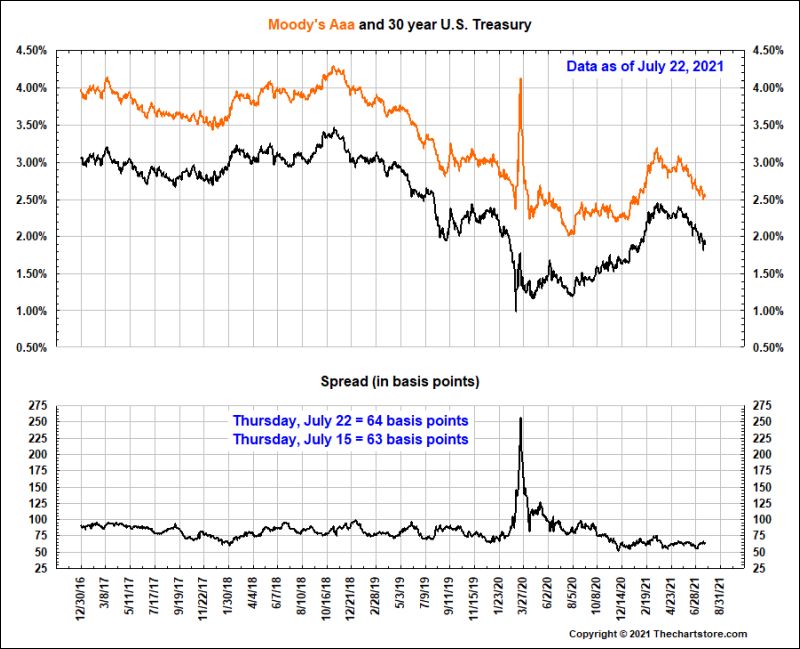
Chart 55
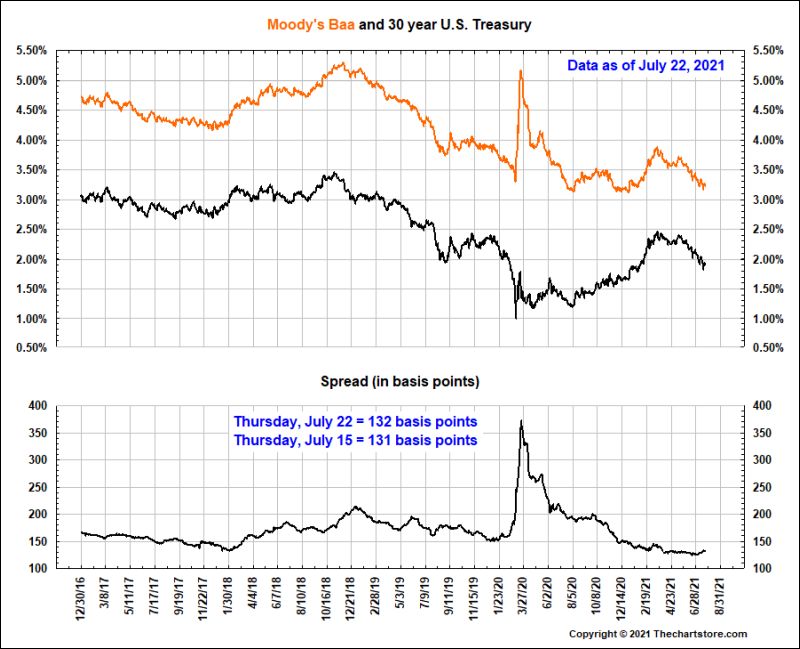
Chart 56
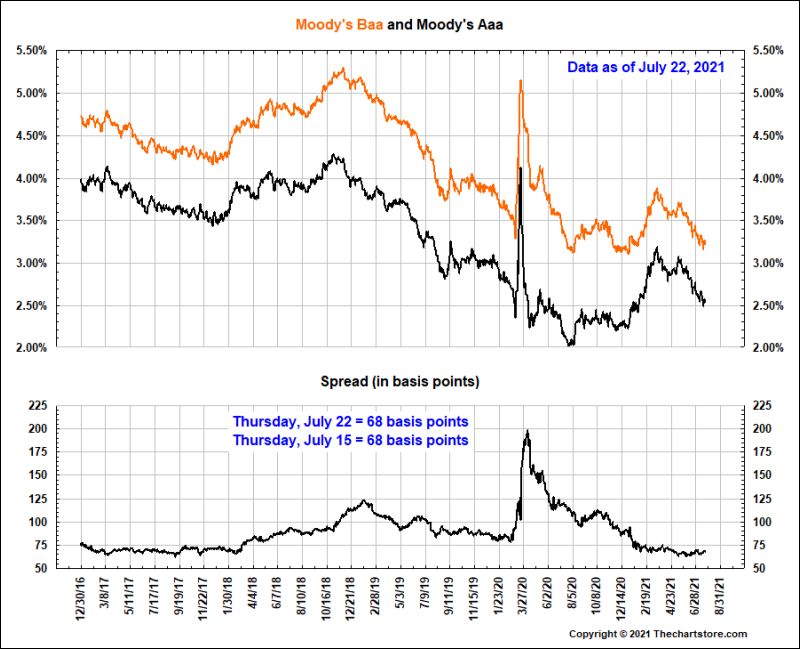
Chart 57
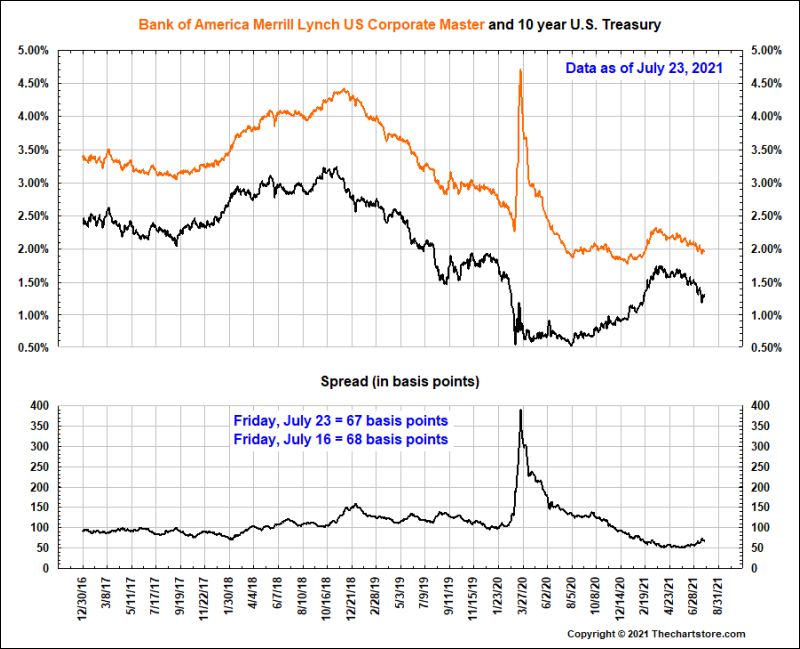
Chart 58
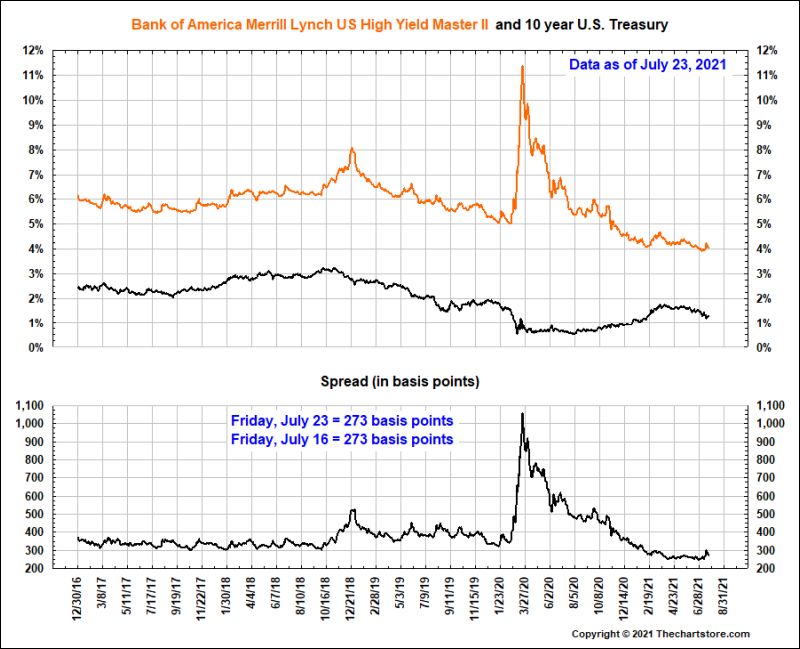
Chart 59
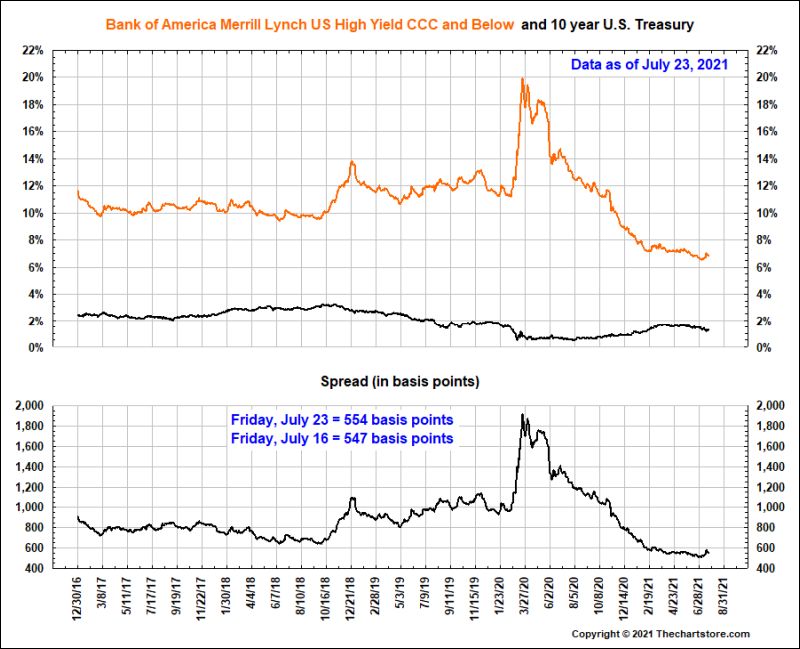
Chart 60
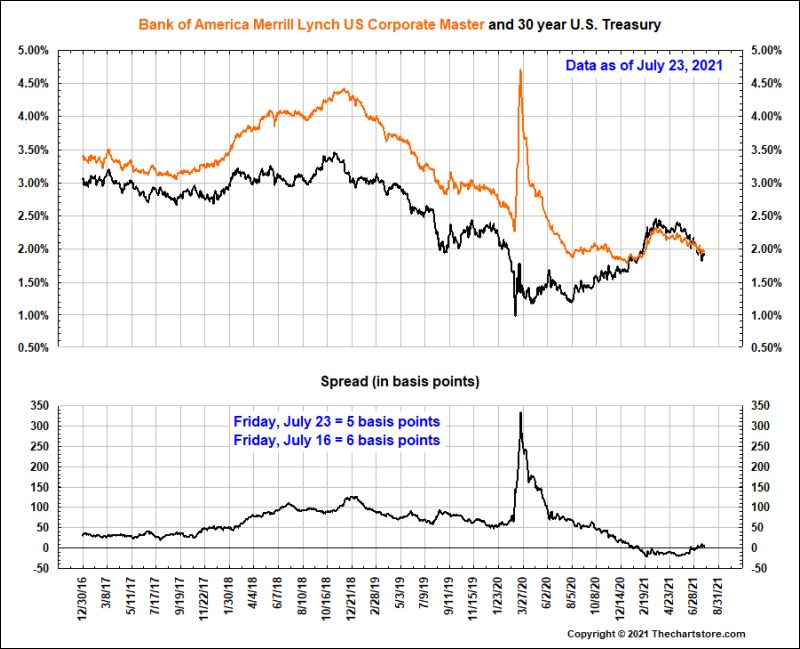
Chart 61
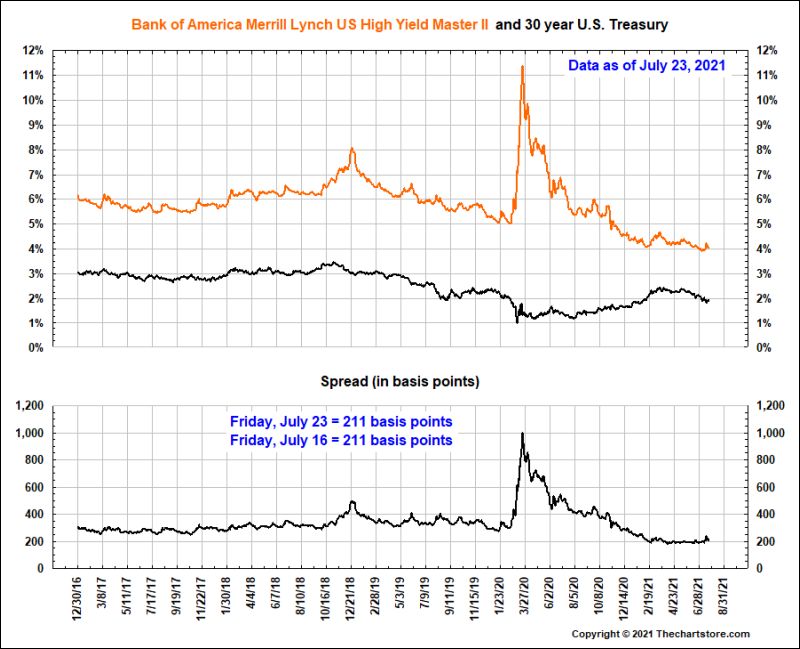
Chart 62
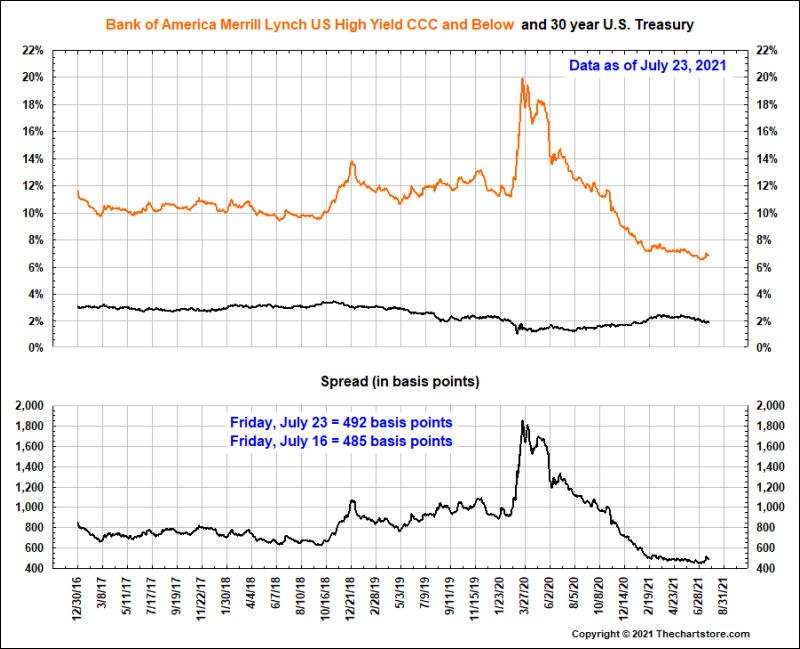
Chart 63
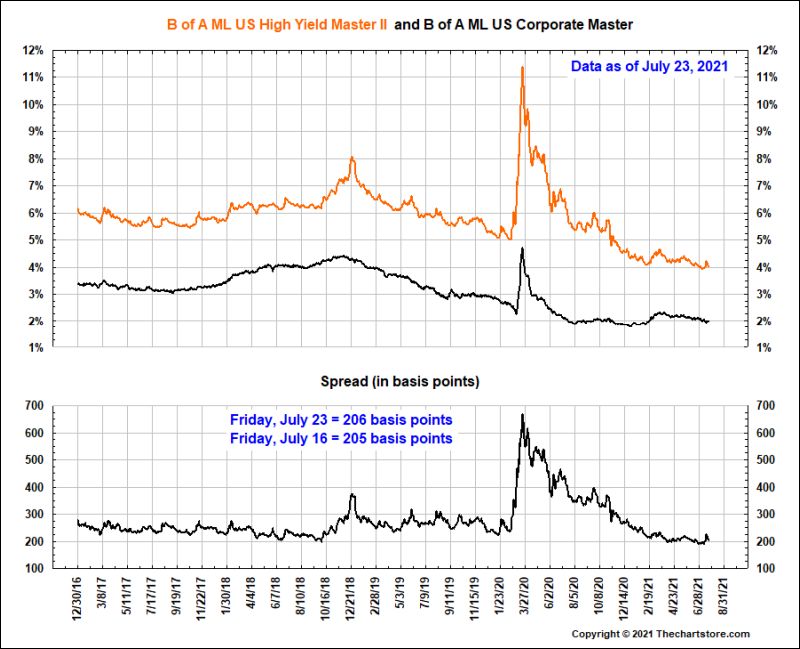
Chart 64
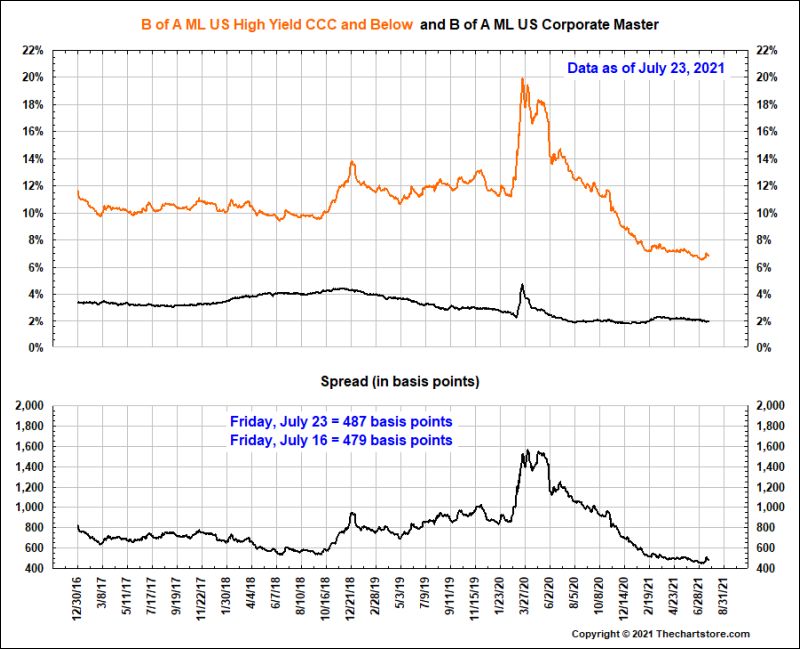
Chart 65
Currency Watch
Chart 66
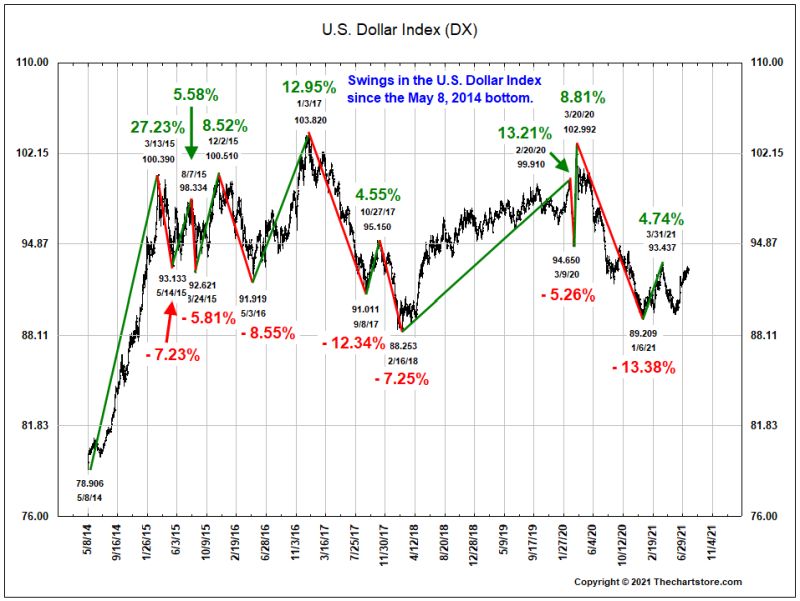
Chart 67
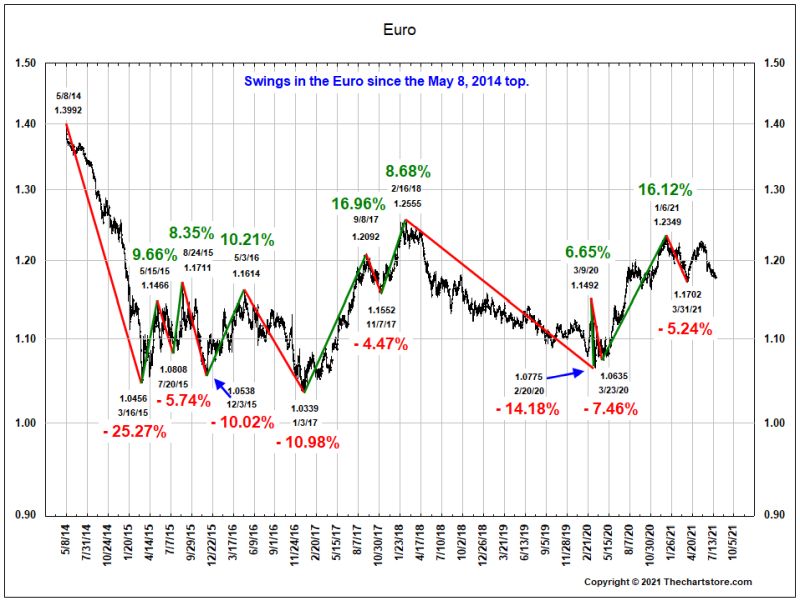
Chart 68
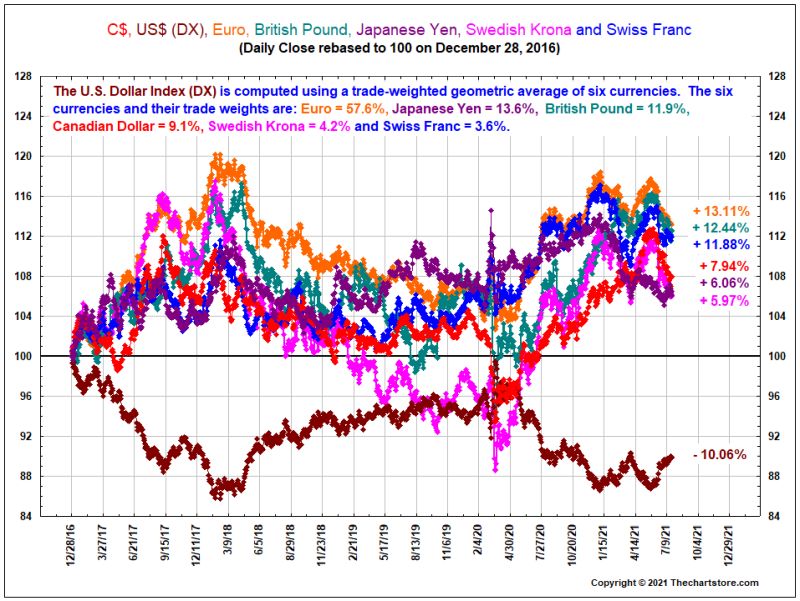
Chart 69
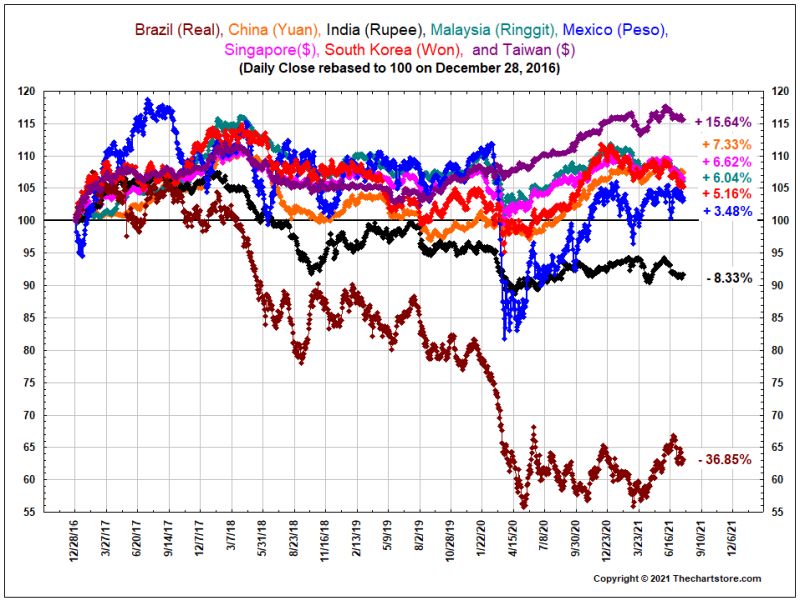
Chart 70
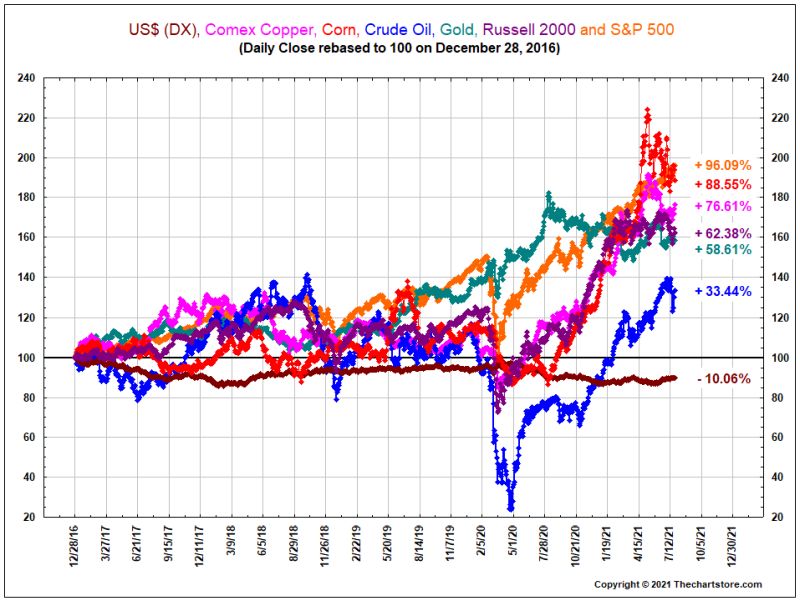
Chart 71
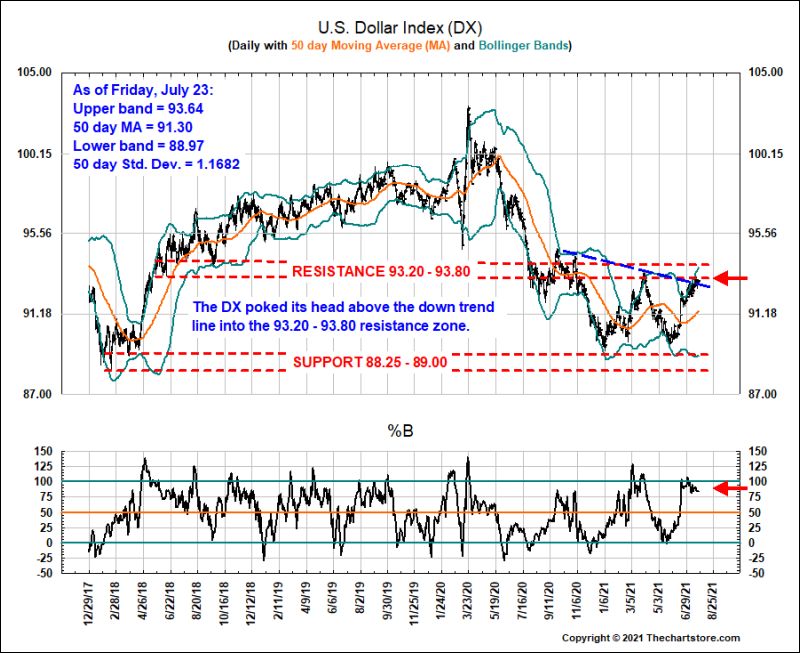
Chart 72
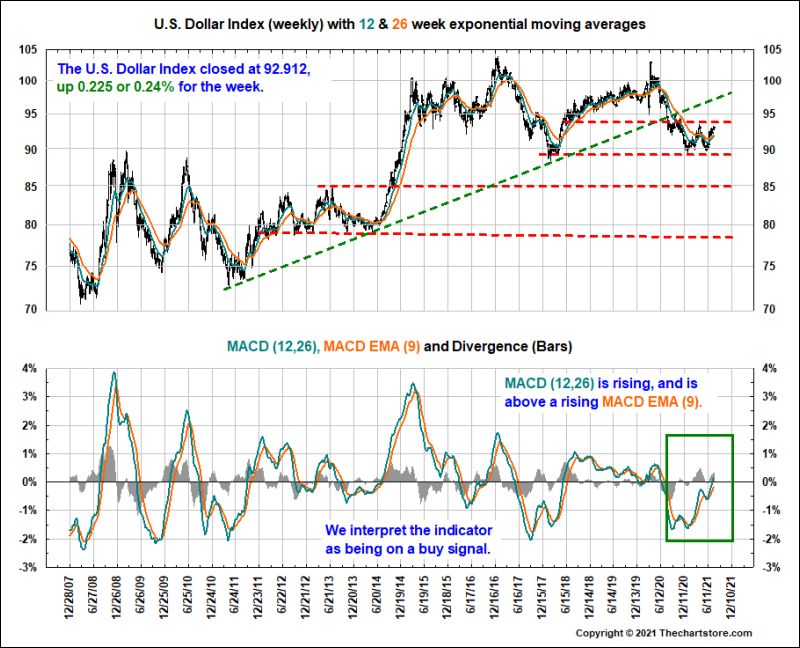
Chart 73
Commodity Watch
Chart 74
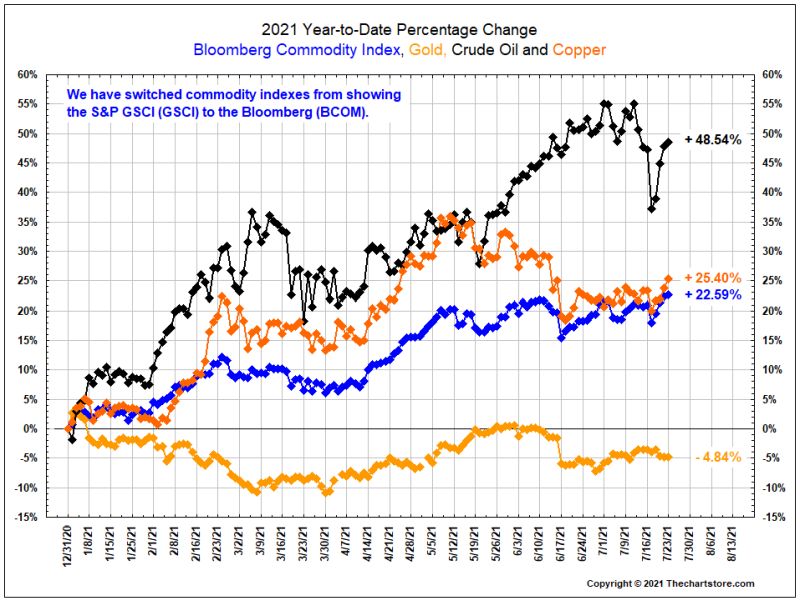
Chart 75
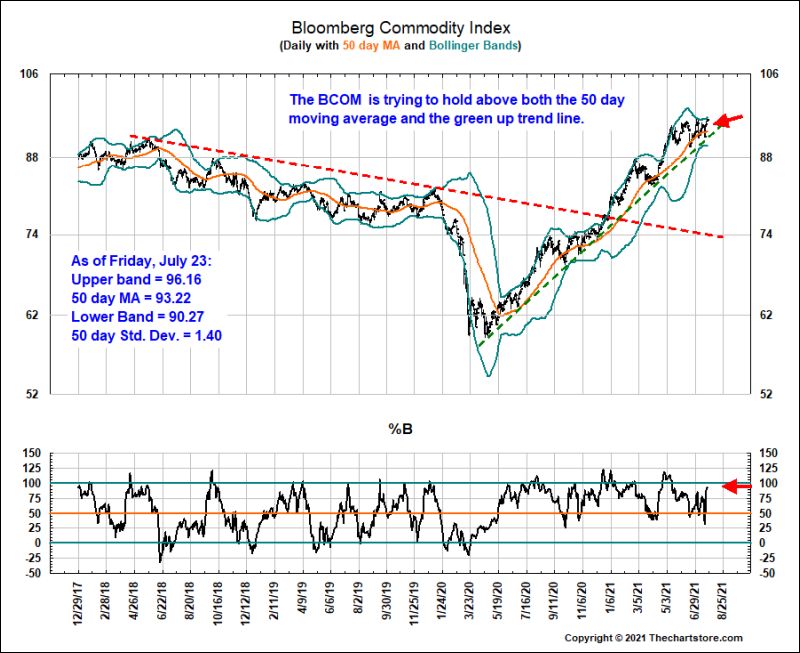
Chart 76
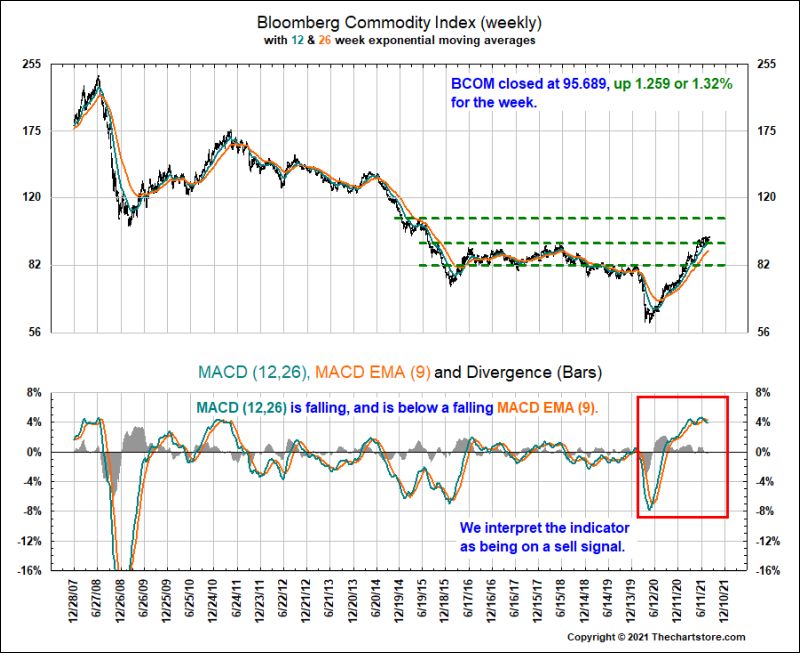
Chart 77
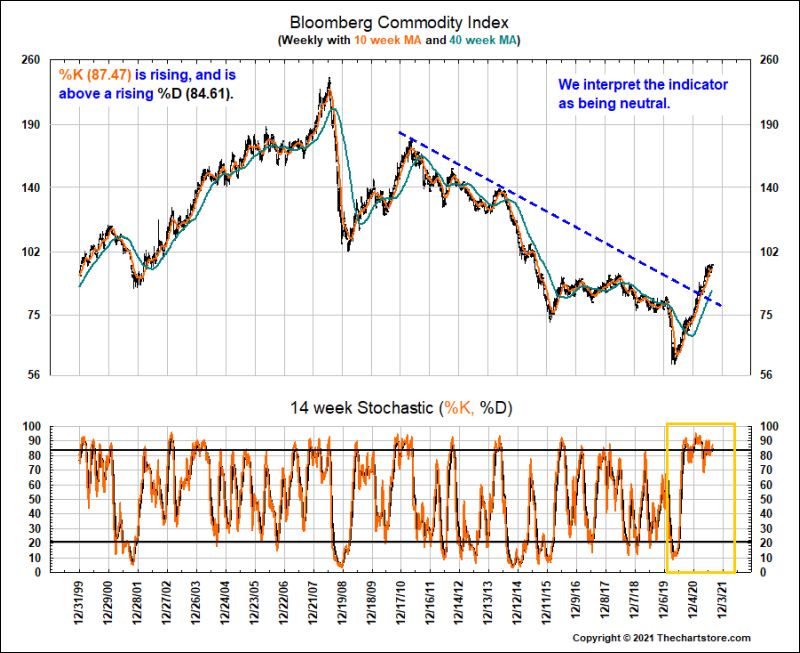
Chart 78
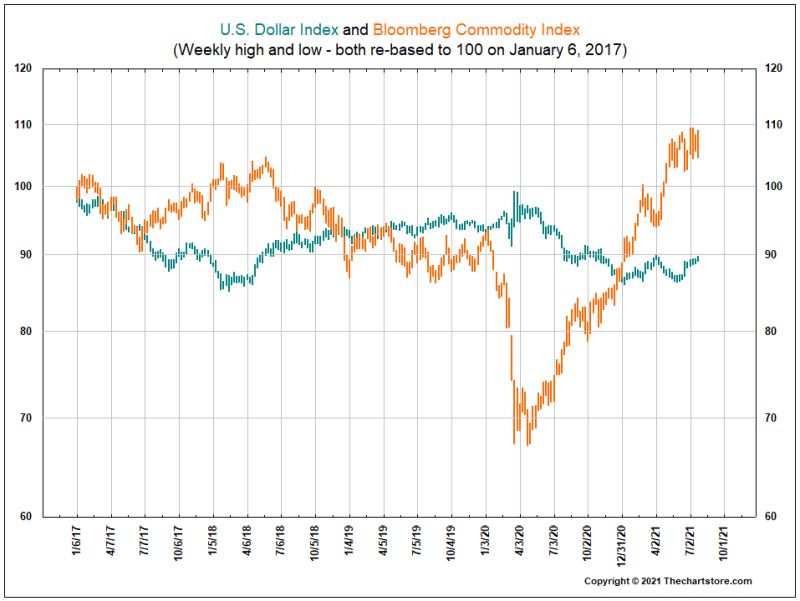
Chart 79
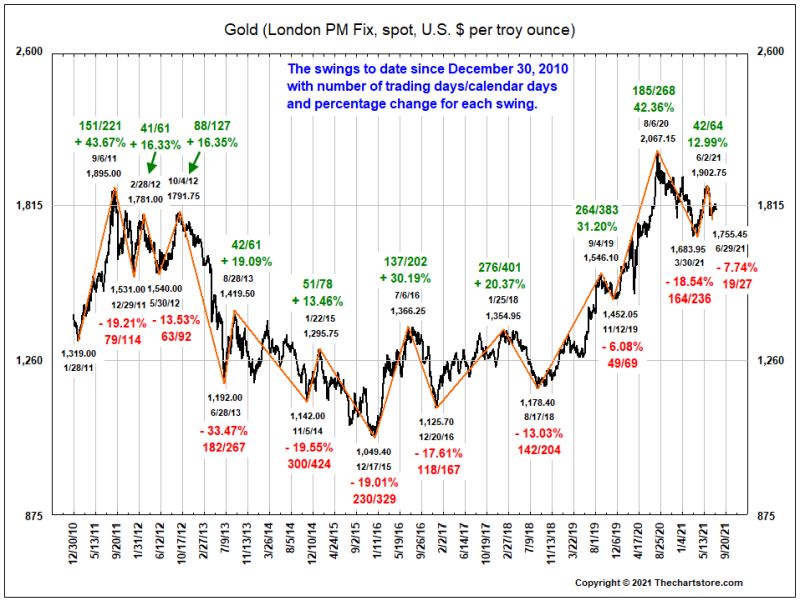
Chart 80
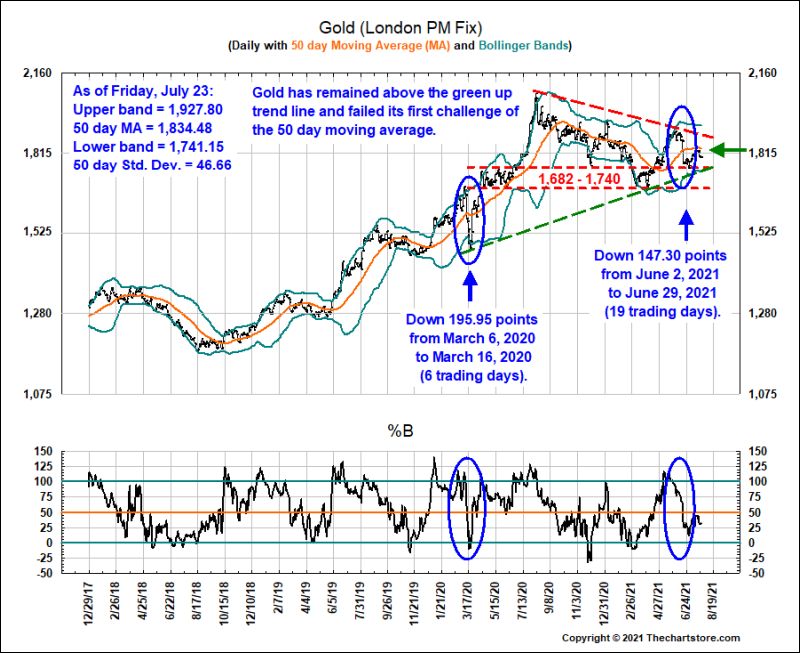
Chart 81
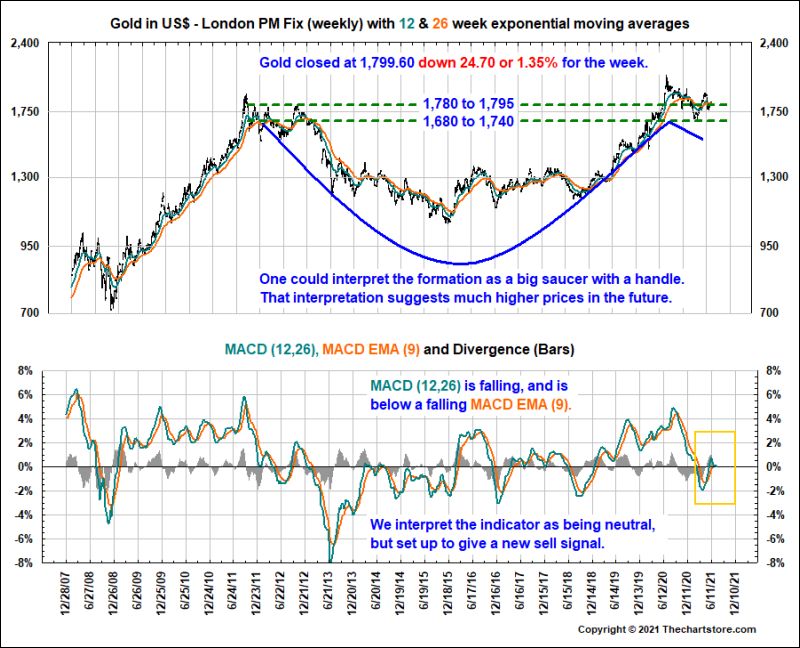
Chart 82
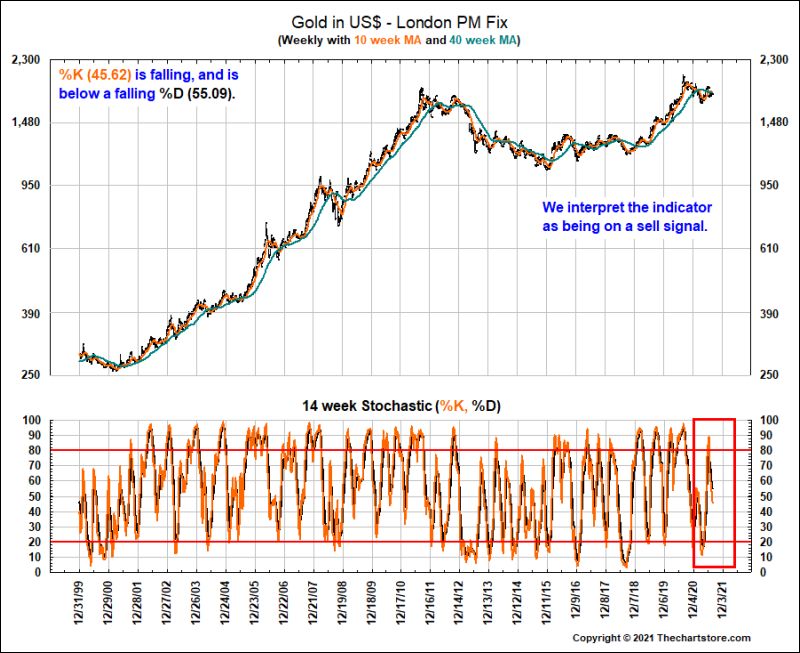
Chart 83
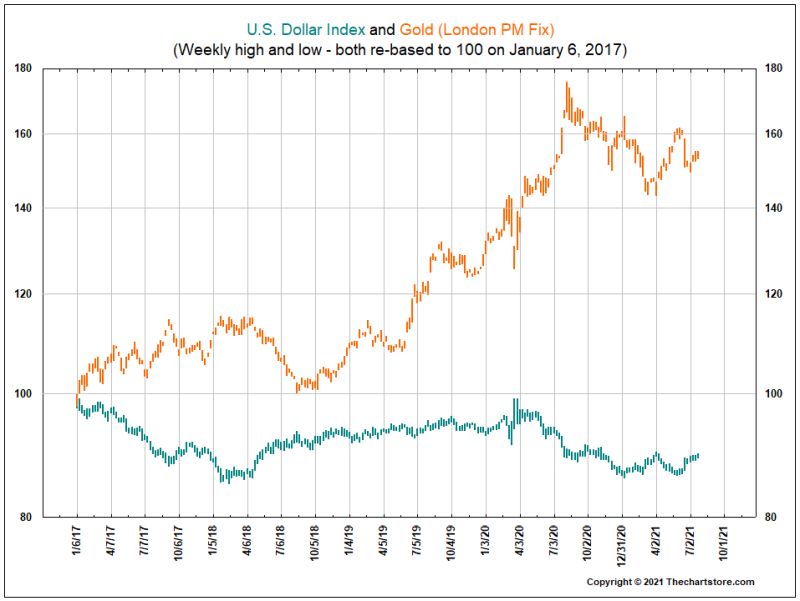
Chart 84
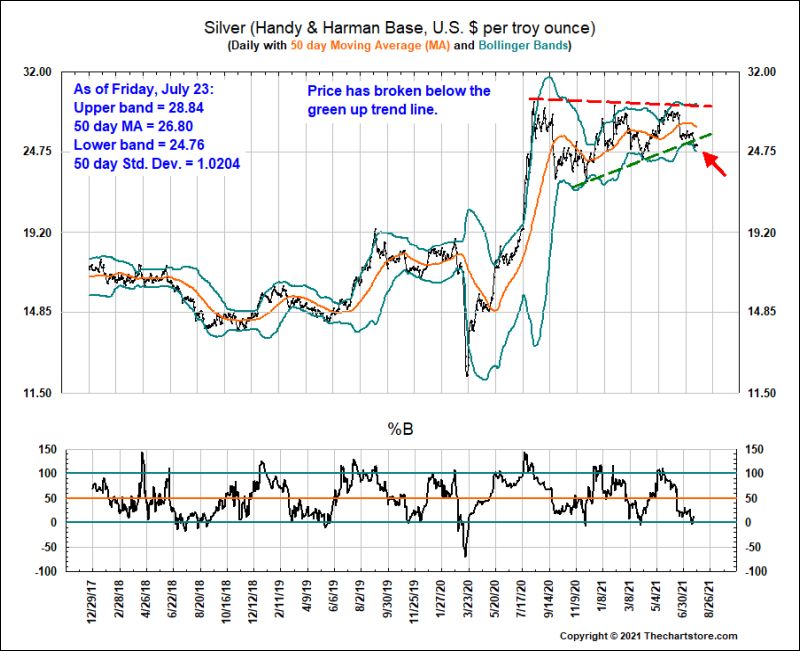
Chart 85
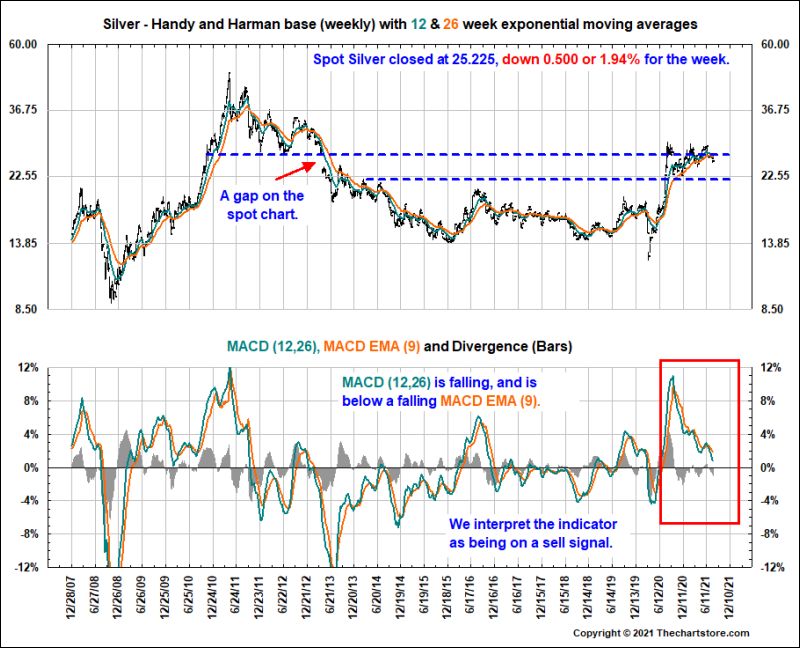
Chart 86
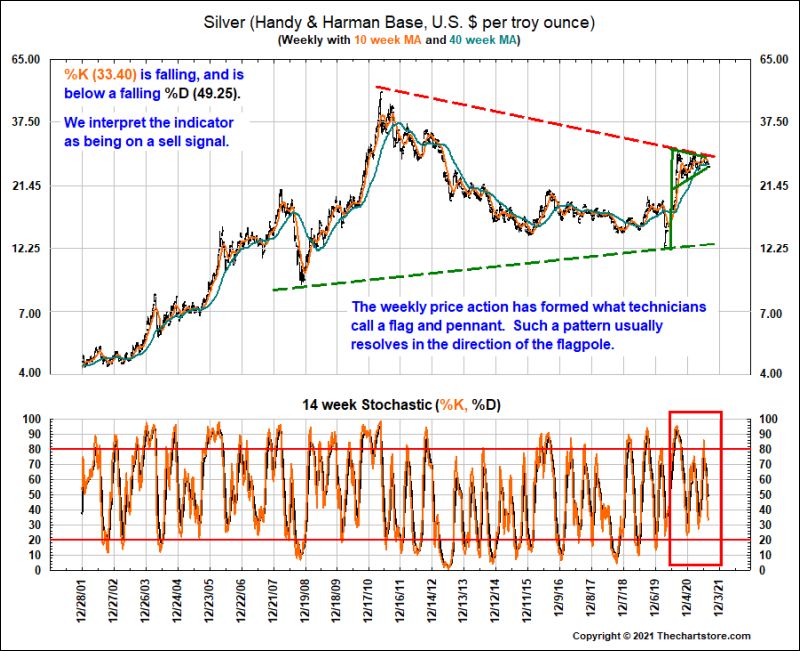
Chart 87
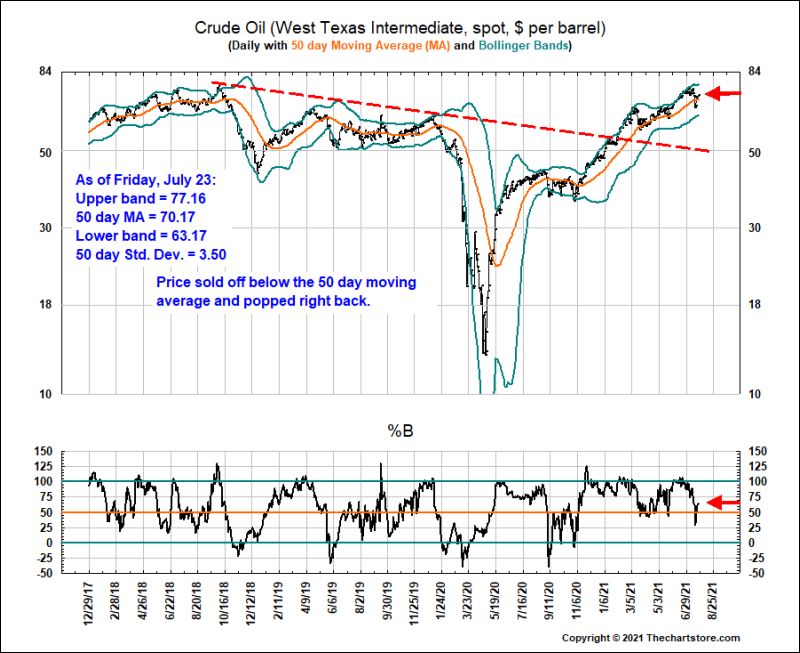
Chart 88
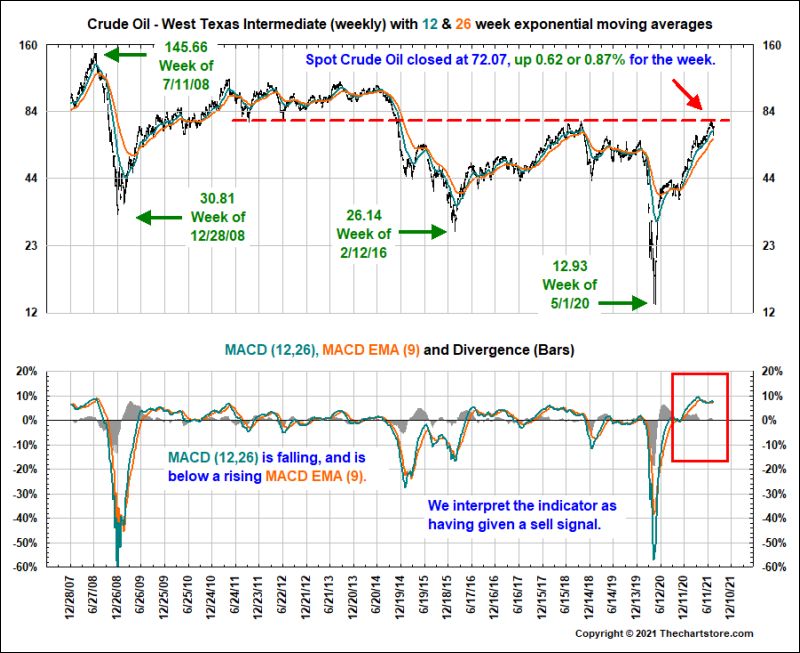
Chart 89
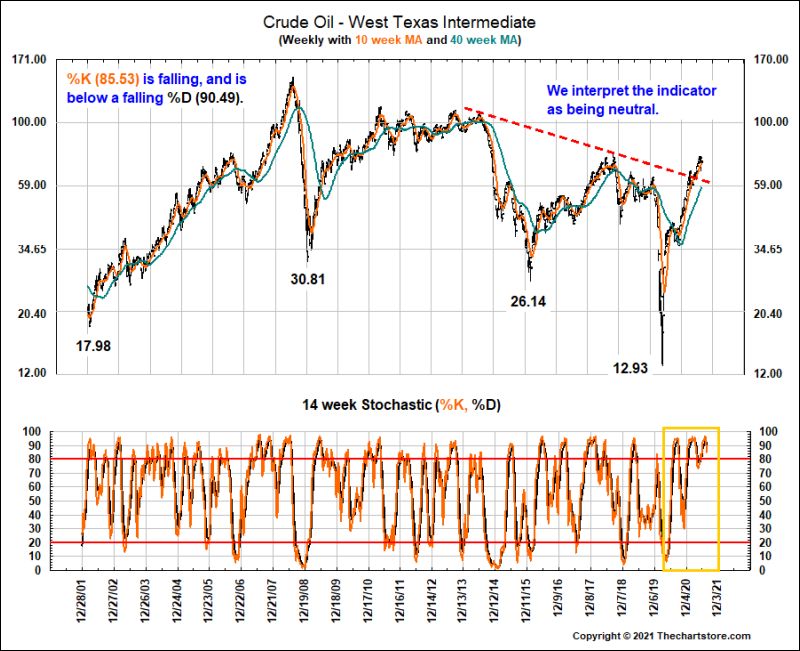
Chart 90
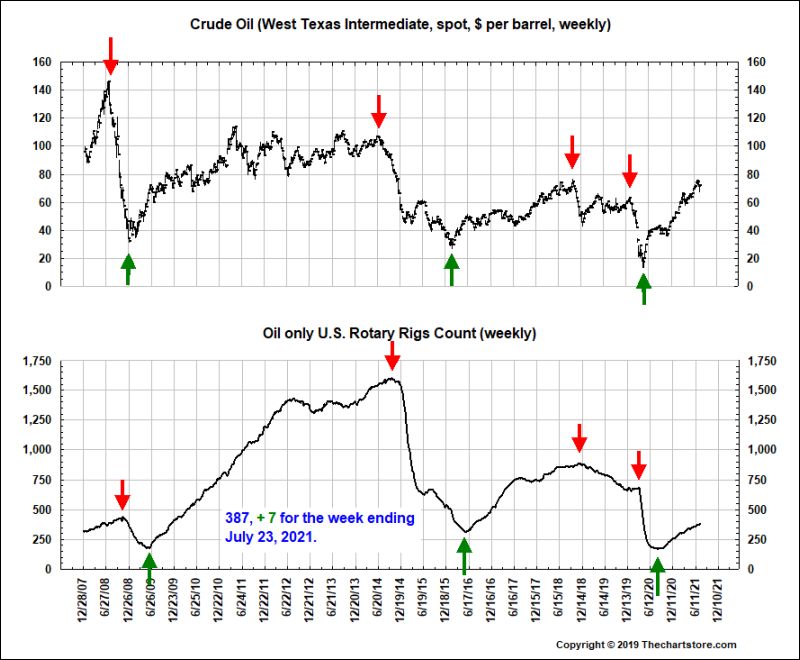
Chart 91
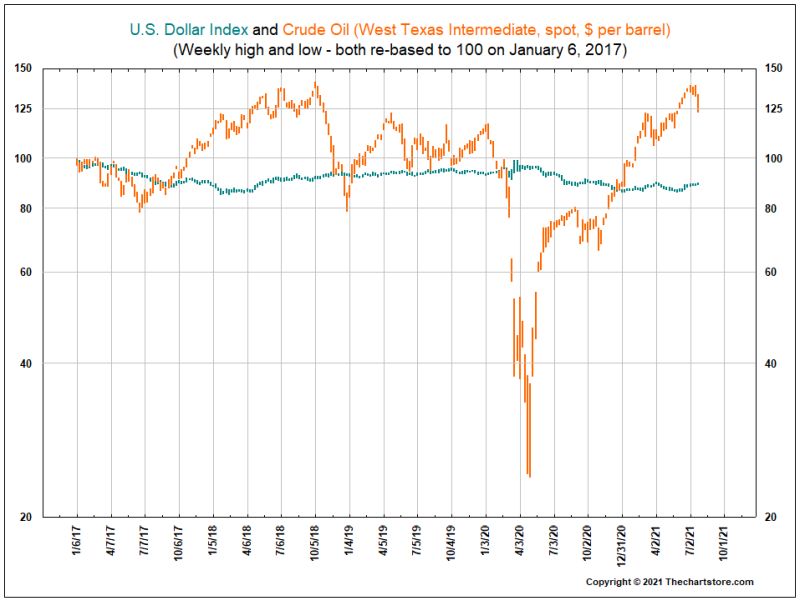
Chart 92
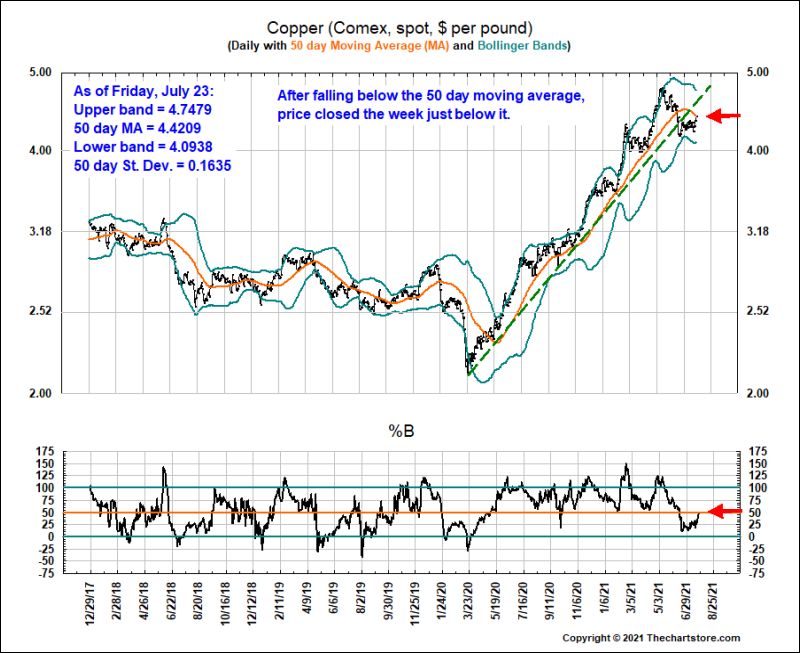
Chart 93
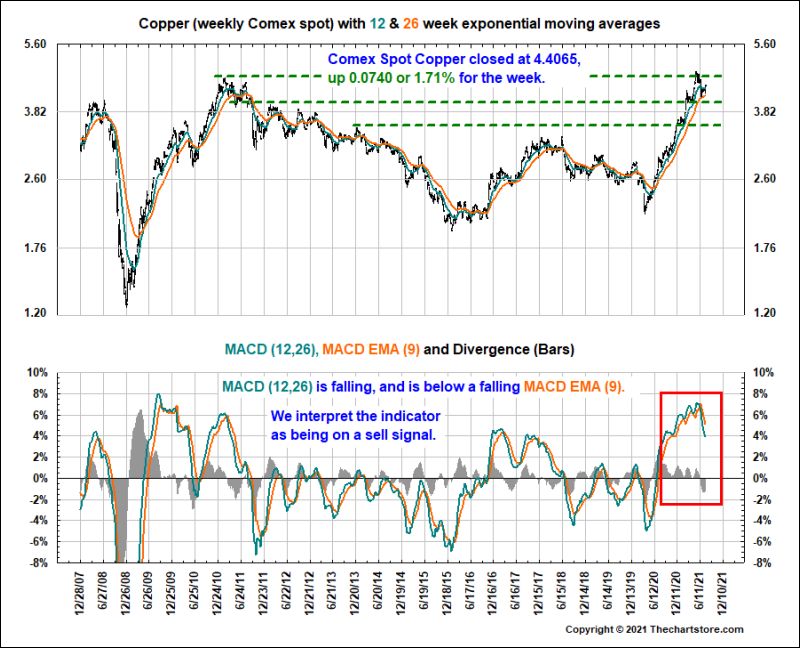
Chart 94
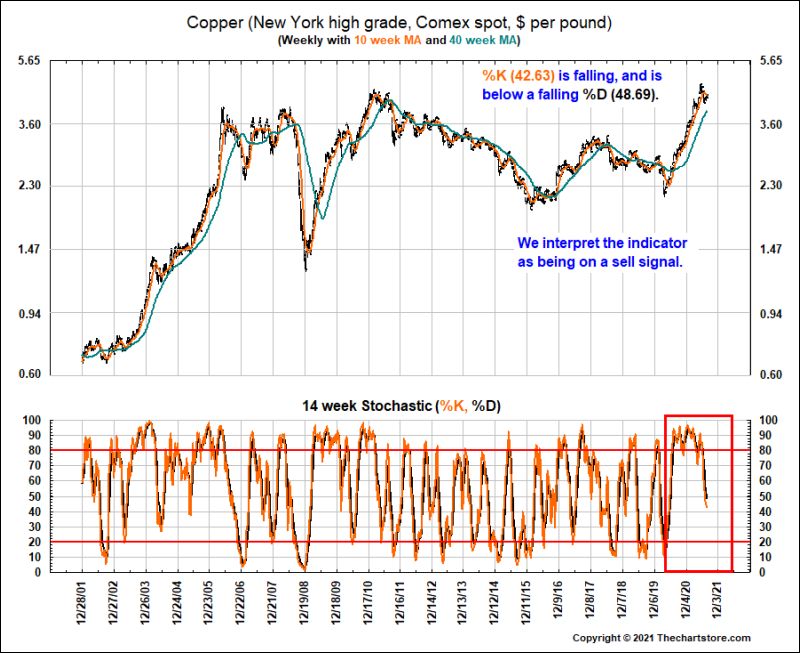
Chart 95
Fed Watch
Chart 96
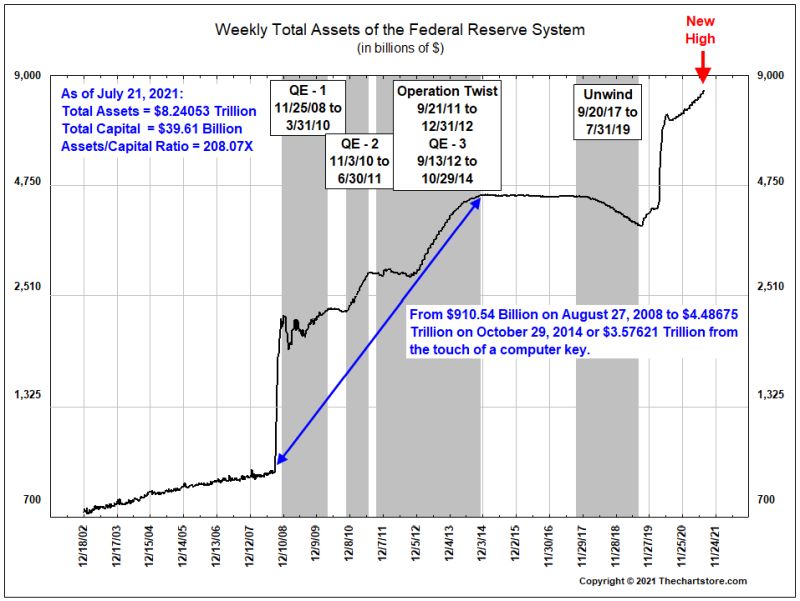
Chart 97
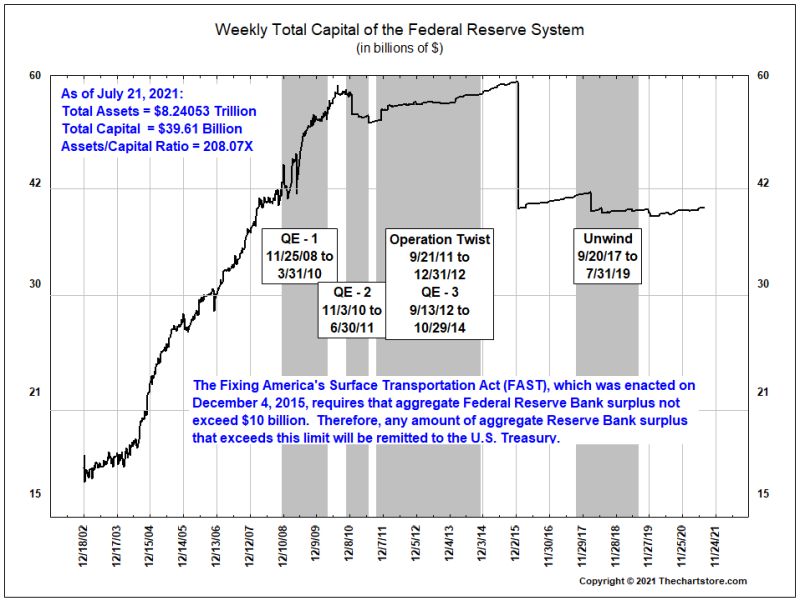
Chart 98
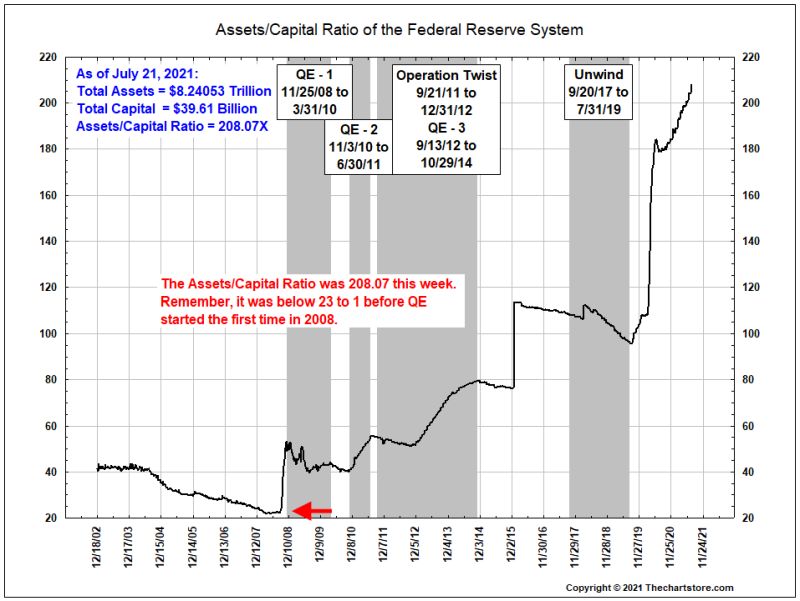
Chart 99
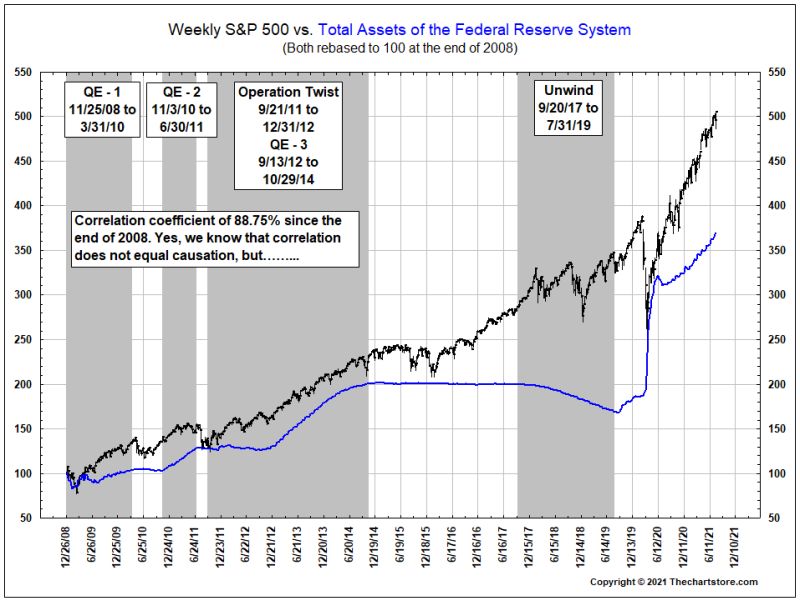
Chart 100
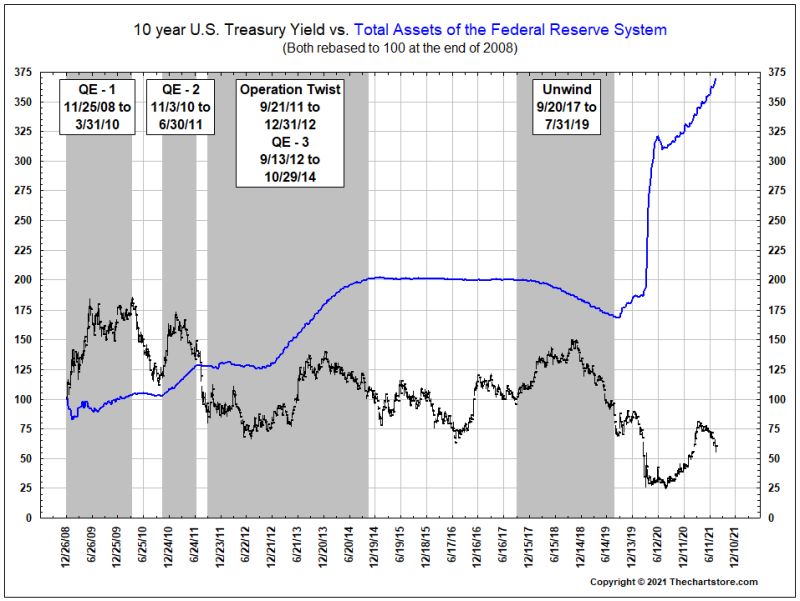
Chart 101
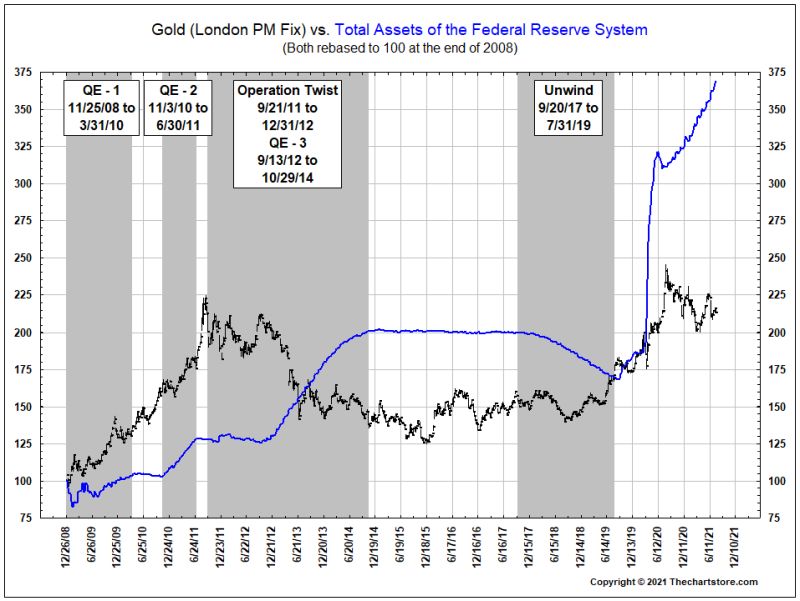
Chart 102
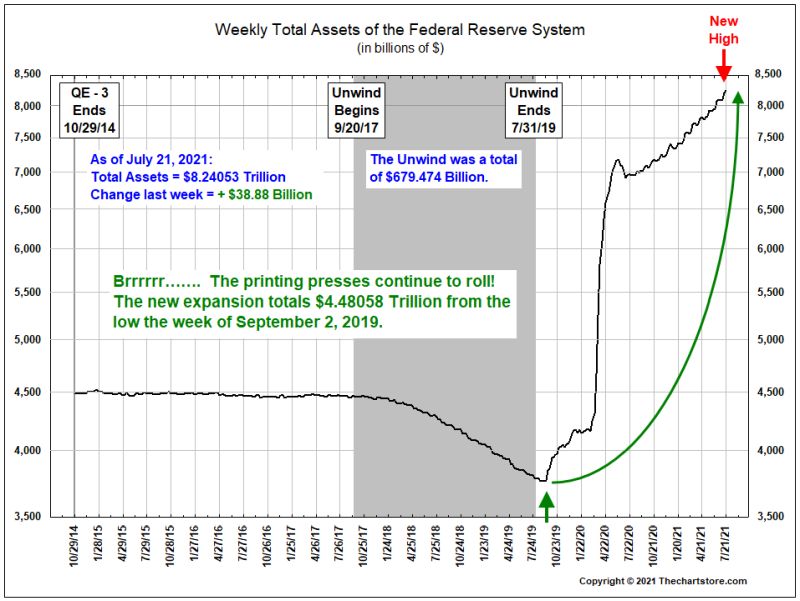
Chart 103
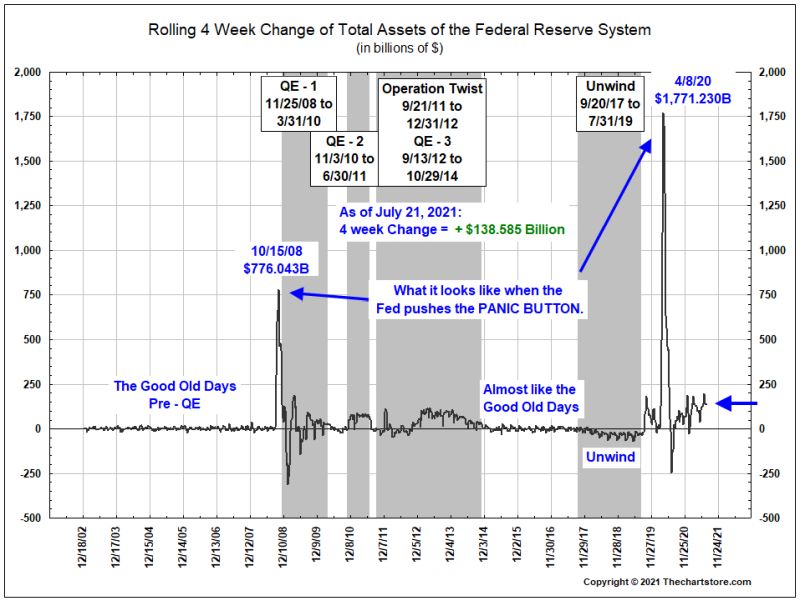
Chart 104
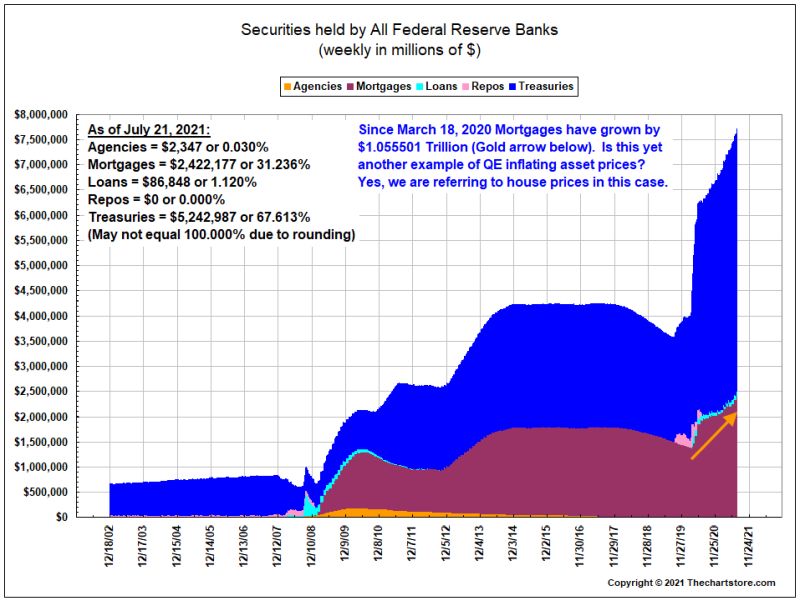
Chart 105
Housing Watch
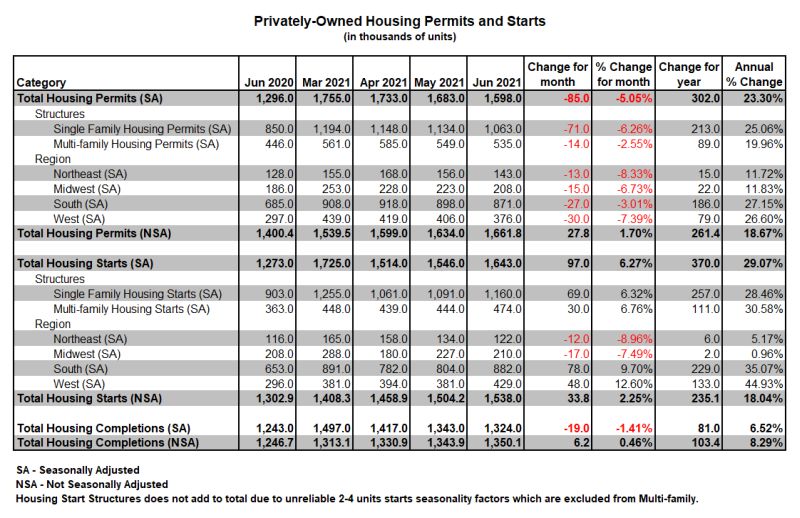
Chart 106
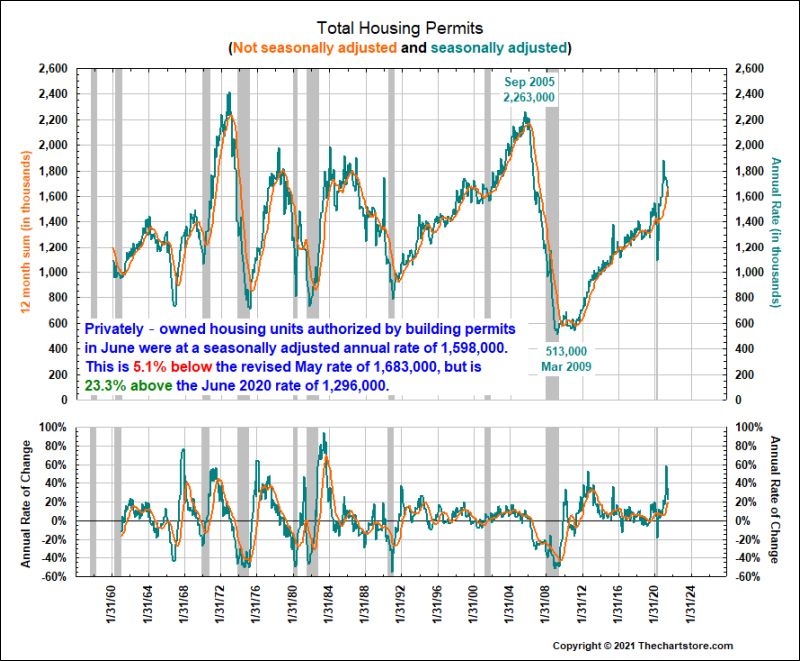
Chart 107
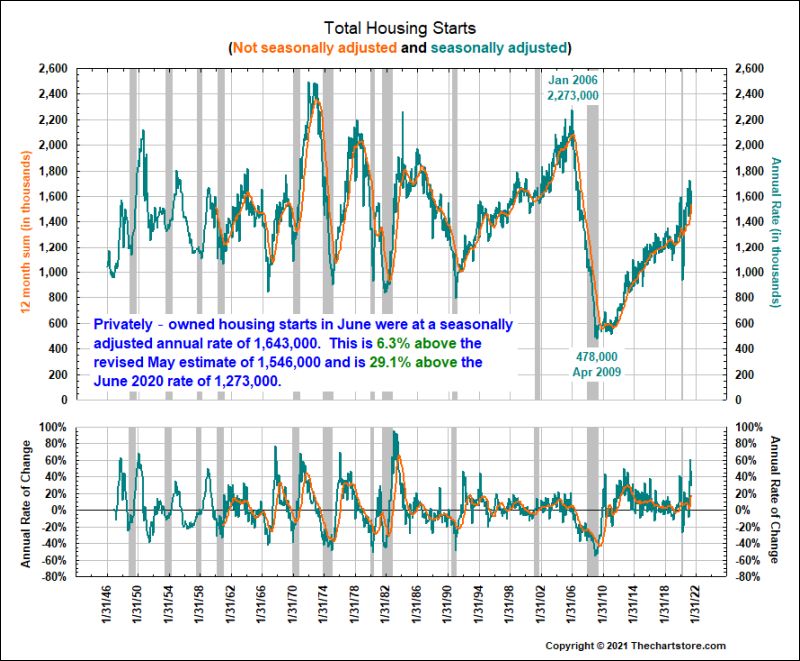
Chart 108
A Look at Gold Returns
Chart 109
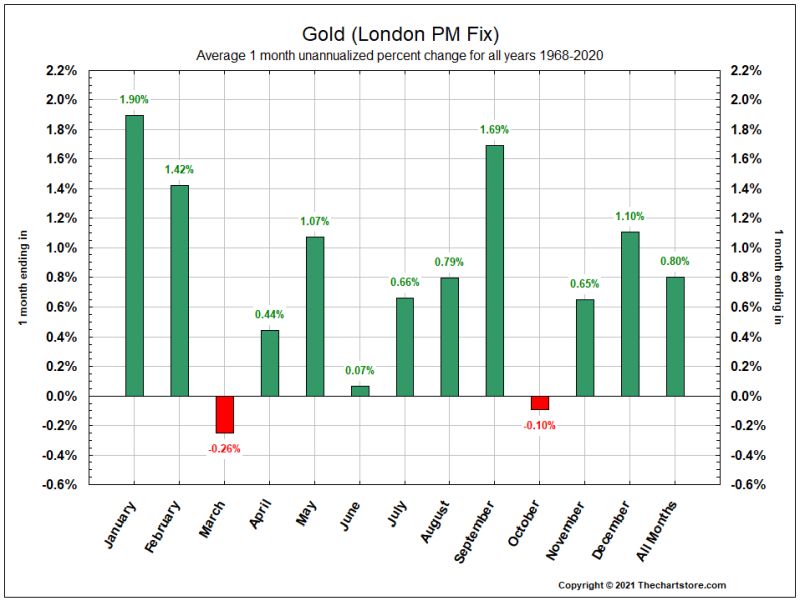
Chart 110
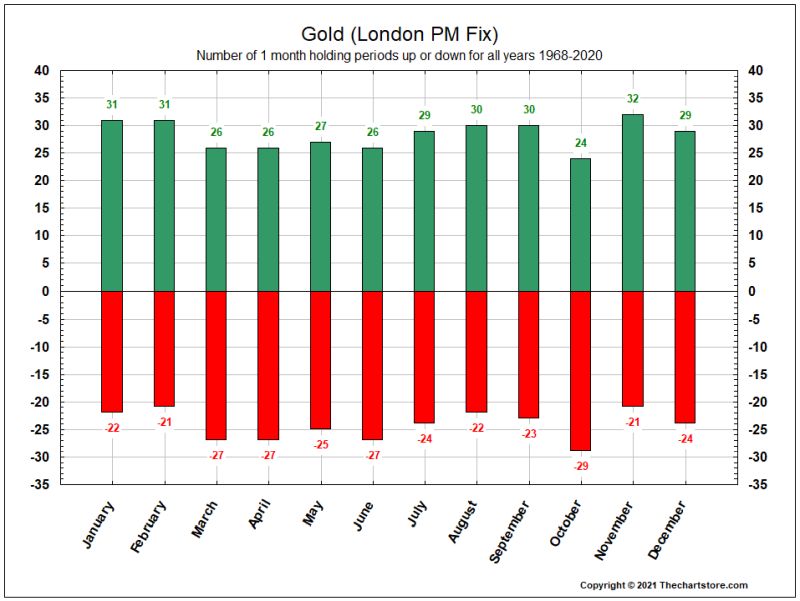
Chart 111
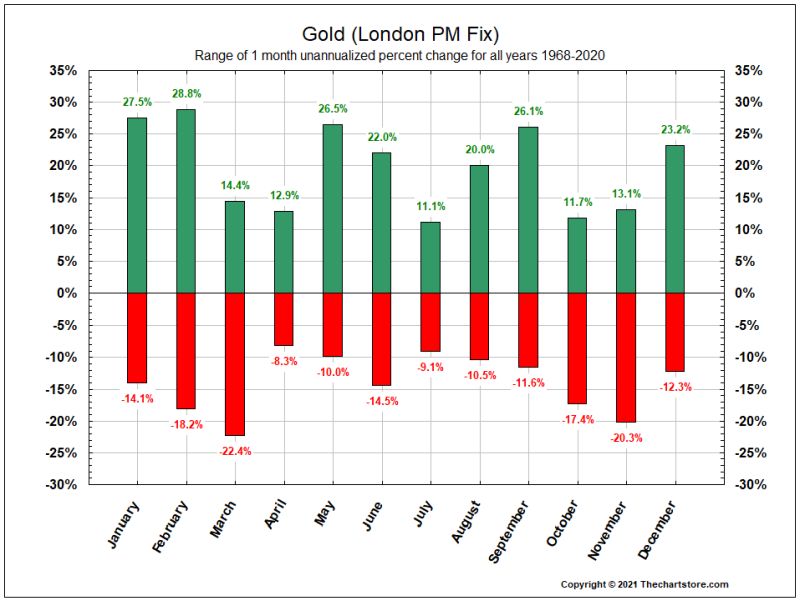
Chart 112
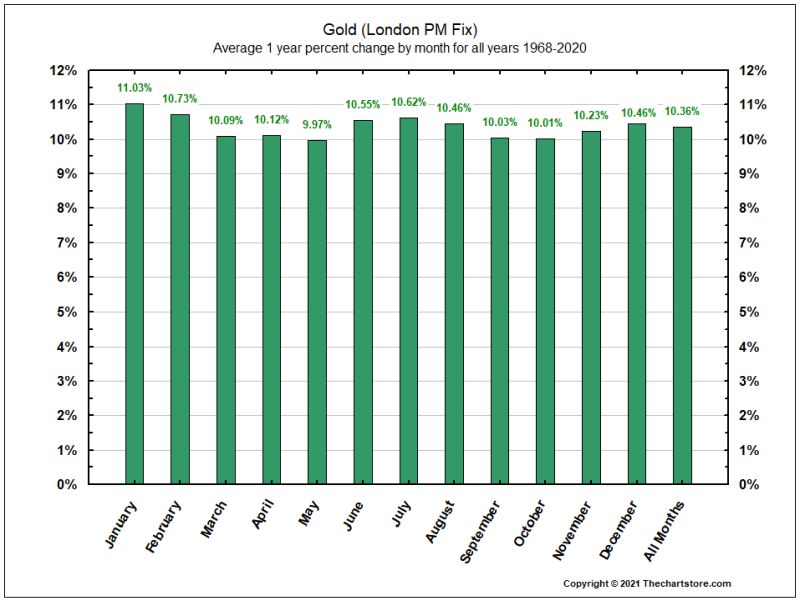
Chart 113
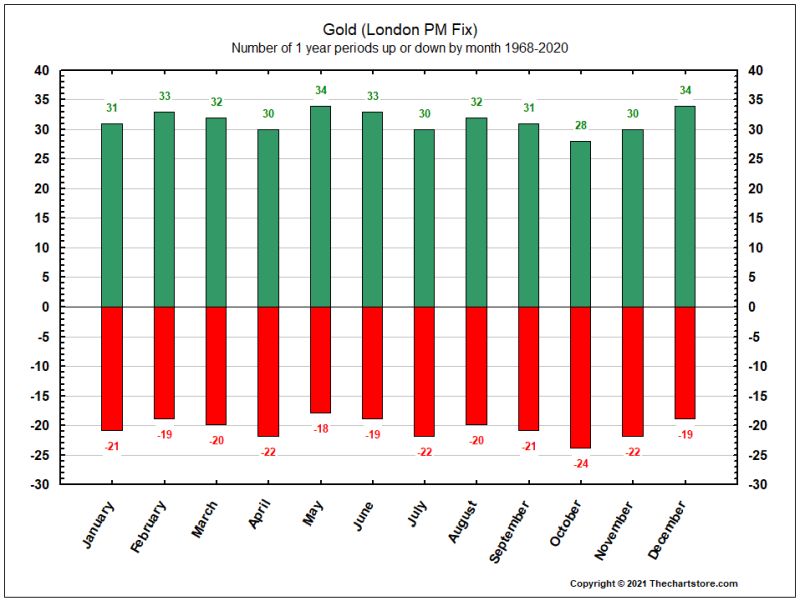
Chart 114
That's it for this week.....
To send us an email with a comment on this blog, click here.
Thechartstore.com does not promote the use of the information contained herein for any specific purpose, and makes no representations or warranties that the information contained in this publication is suitable for the particular purposes of the subscriber or any other party. Thechartstore.com assumes no responsibility or liability of any kind for the use of the information contained herein by the subscriber or any other party. Reproduction of any or all of the Weekly Chart Blog without prior permission is prohibited.